Chapter 2 Notes
Numerics from example runs
Run 1
Greedy policy
- Pure exploitation
- No exploration
- Got lucky because was best action and it was selected by arg-max on first iteration
| Count | R Accum. | |||
|---|---|---|---|---|
| 1 | 1000 | 956.5 | 0.9565 | 0.9316 |
| 2 | 0 | 0.0 | 0.0000 | -0.7628 |
| 3 | 0 | 0.0 | 0.0000 | -0.2383 |
| 4 | 0 | 0.0 | 0.0000 | -0.5191 |
| 5 | 0 | 0.0 | 0.0000 | 0.4432 |
| 6 | 0 | 0.0 | 0.0000 | 0.6307 |
| 7 | 0 | 0.0 | 0.0000 | 0.6361 |
| 8 | 0 | 0.0 | 0.0000 | -0.3312 |
| 9 | 0 | 0.0 | 0.0000 | 0.6138 |
| 10 | 0 | 0.0 | 0.0000 | 0.3032 |
-Greedy policy with
- Exploration and exploitation evident
| Count | R Accum. | |||
|---|---|---|---|---|
| 903 | 835.3 | 0.9251 | 0.9316 | |
| 11 | -14.0 | -1.2754 | -0.7628 | |
| 10 | -2.2 | -0.2226 | -0.2383 | |
| 17 | -9.4 | -0.5506 | -0.5191 | |
| 9 | 0.6 | 0.0698 | 0.4432 | |
| 9 | 6.4 | 0.7164 | 0.6307 | |
| 8 | -0.0 | -0.0050 | 0.6361 | |
| 11 | -5.8 | -0.5279 | -0.3312 | |
| 13 | 3.4 | 0.2612 | 0.6138 | |
| 9 | -0.8 | -0.0861 | 0.3032 |
Run 2
Greedy policy
- Pure exploitation
- No exploration
- Failed to find the best action because no exploration
- Spent most of its actions on which was the best action that had been seen in early stages of averaging
| Count | R Accum. | |||
|---|---|---|---|---|
| 1 | 24 | -1.0 | -0.0400 | -0.4828 |
| 2 | 1 | -1.5 | -1.4800 | -0.9959 |
| 3 | 1 | -0.1 | -0.1149 | 0.2333 |
| 4 | 974 | 303.7 | 0.3118 | 0.3565 |
| 5 | 0 | 0.0 | 0.0000 | -0.8226 |
| 6 | 0 | 0.0 | 0.0000 | 0.1425 |
| 7 | 0 | 0.0 | 0.0000 | 1.4684 |
| 8 | 0 | 0.0 | 0.0000 | -0.4728 |
| 9 | 0 | 0.0 | 0.0000 | 0.5024 |
| 10 | 0 | 0.0 | 0.0000 | -1.6466 |
-Greedy policy with
- Exploration and exploitation evident
- Found the best action through exploration and then exploited it
| Count | R Accum. | |||
|---|---|---|---|---|
| 1 | 8 | -2.3 | -0.2921 | -0.4828 |
| 2 | 13 | -14.7 | -1.1314 | -0.9959 |
| 3 | 7 | -0.3 | -0.0441 | 0.2333 |
| 4 | 9 | 2.9 | 0.3270 | 0.3565 |
| 5 | 11 | -8.8 | -0.7993 | -0.8226 |
| 6 | 15 | -0.9 | -0.0585 | 0.1425 |
| 7 | 913 | 1352.4 | 1.4812 | 1.4684 |
| 8 | 10 | -0.3 | -0.0337 | -0.4728 |
| 9 | 8 | 8.5 | 1.0590 | 0.5024 |
| 10 | 6 | -5.5 | -0.9111 | -1.6466 |
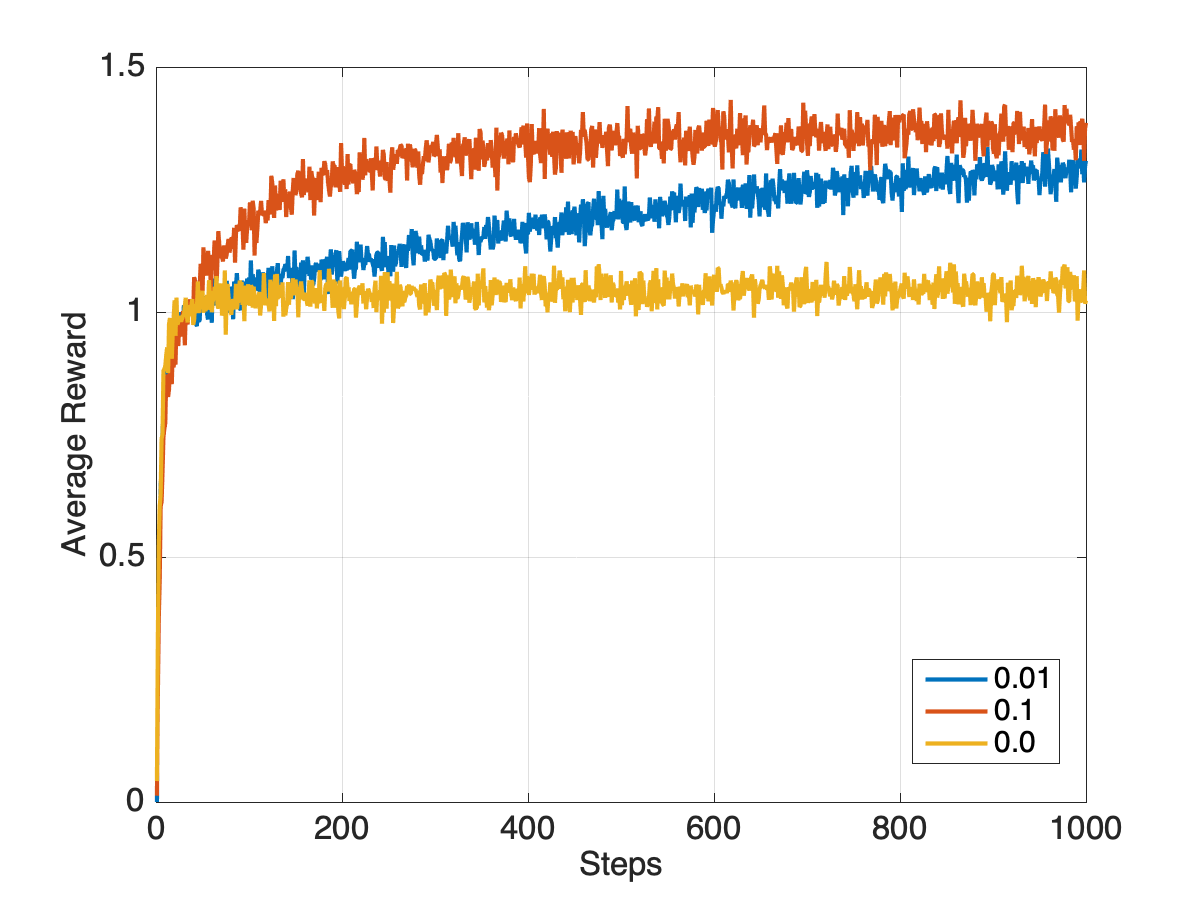
Observation
Based on these example runs, we can see why the final long term (after 1000 steps) reward of -greedy policy is greater than for the pure greedy policy, though the opposite can be true in the short term (first 10-20 steps).
Matlab code for testbed
xxxxxxxxxxK = 10; % Number of armsN = 1000; % Number of steps per runM = 2000; % Number of runsRave = zeros(N,1);for m = 1:M q = randn(K,1); % True action value Q = zeros(K,1); % Estimated action value C = zeros(K,1); % Counts D = zeros(K,1); % Accumulated reward for n = 1:N % epsilon-greedy policy epsilon = 0.1; u = rand(); % Draw random number U[0,1] if(u > epsilon) [~,a]=max(Q); % Exploitation (greedy) action else a = randi([1,K],1); % Exploration (random) action end R = q(a) + randn(); % Draw reward at random from PDF depending on action D(a) = D(a) + R; % Accumulate reward C(a) = C(a) + 1; % Increment count Q(a) = D(a)/C(a); % Update estimated value Rave(n) = Rave(n) + R; endend