Shelving Filters - Application of DTFT Properties
Review: Ideal Low Pass Filter
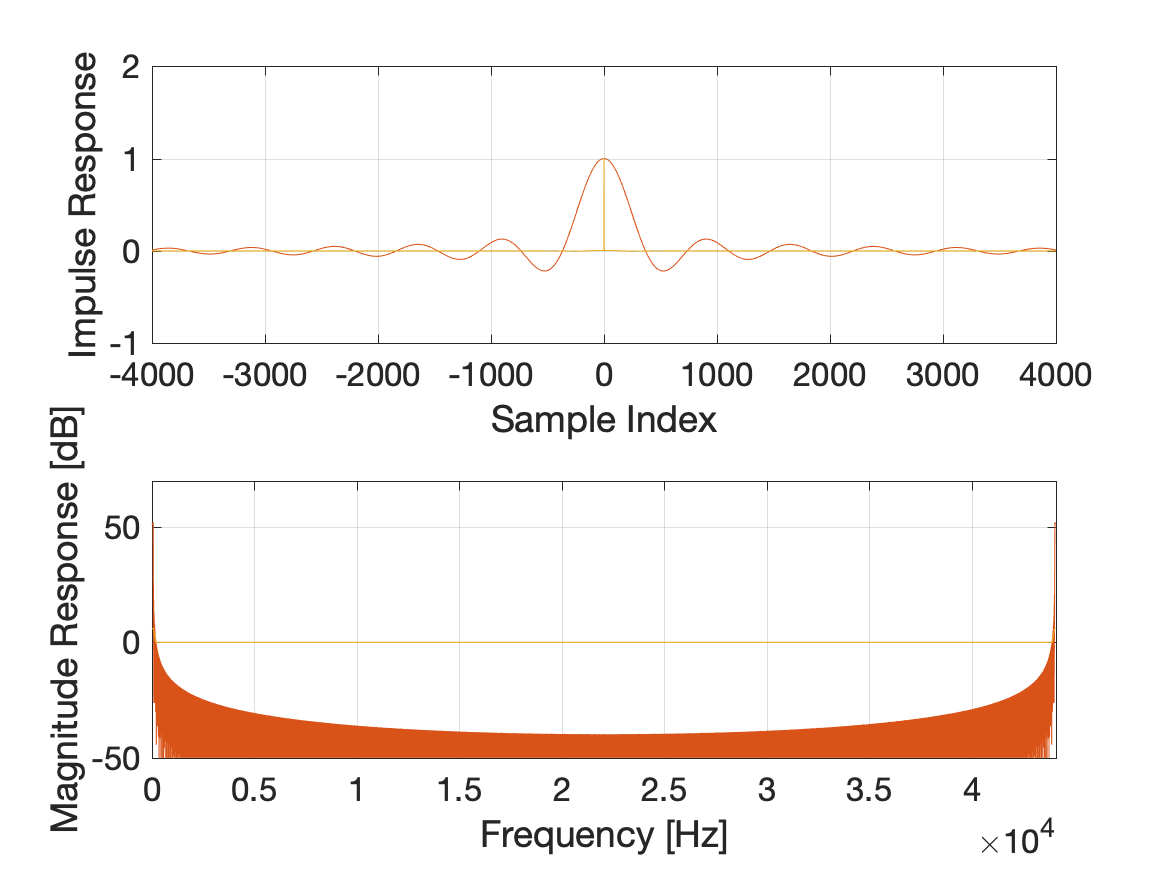
Recall that the ideal low pass filter has frequency response given by
The impulse response may be obtained using the inverse DTFT formula
Note that the ideal low pass filter has an infinite impulse response (IIR) and is non-causal and unstable. We say that it is unrealizable.
Shelving Filter
A shelving filter boots some frequencies and leaves others unchanged. An ideal shelving filter has a frequency response given by
This would be called a low-shelf filter because it boosts low frequencies. In this case, the boost is a factor of two. High-shelf and mid-shelf filters could also be specified.
The impulse response of the shelving filter may be obtained by integration or by decomposing it into the sum of two filters for which we already know the impulse responses. Consider the following decomposition
The shelving filter may be obtained by adding the response of the ideal low pass filter with an all pass filter. The impulse response may thus be obtained as the sum of the impulse responses of the component filters,
Like the ideal low pass filter, this one is IIR, non-causal, and unstable. An approximation that has finite impulse response (FIR) and is causal and stable may be obtained from by truncation and delay,
This filter has coefficients, a.k.a. "taps". The truncation leads to the Gibbs effect in the frequency domain at frequencies near .
Improved Shelving Filter
The ideal shelving filter makes an instantaneous transition between the two bands. A more gradual transition between bands may be more desirable. The following filter provides a linear transition between bands over an interval of width
Deriving the impulse response for a filter with a complex frequency response such as this is bound to be challenging and also error prone. However, we note that this response may be realized through convolution
where
which has inverse transform
Using the multiplication property of the DTFT, we know that
Therefore, the improved shelving filter has impulse response given by
Plots
Plotting these functions illustrates the several important factors discussed above.
In the following examples, the sample rate was samples/second and Hz and Hz. Normalized frequencies were cycles/sample and cycles/sample.
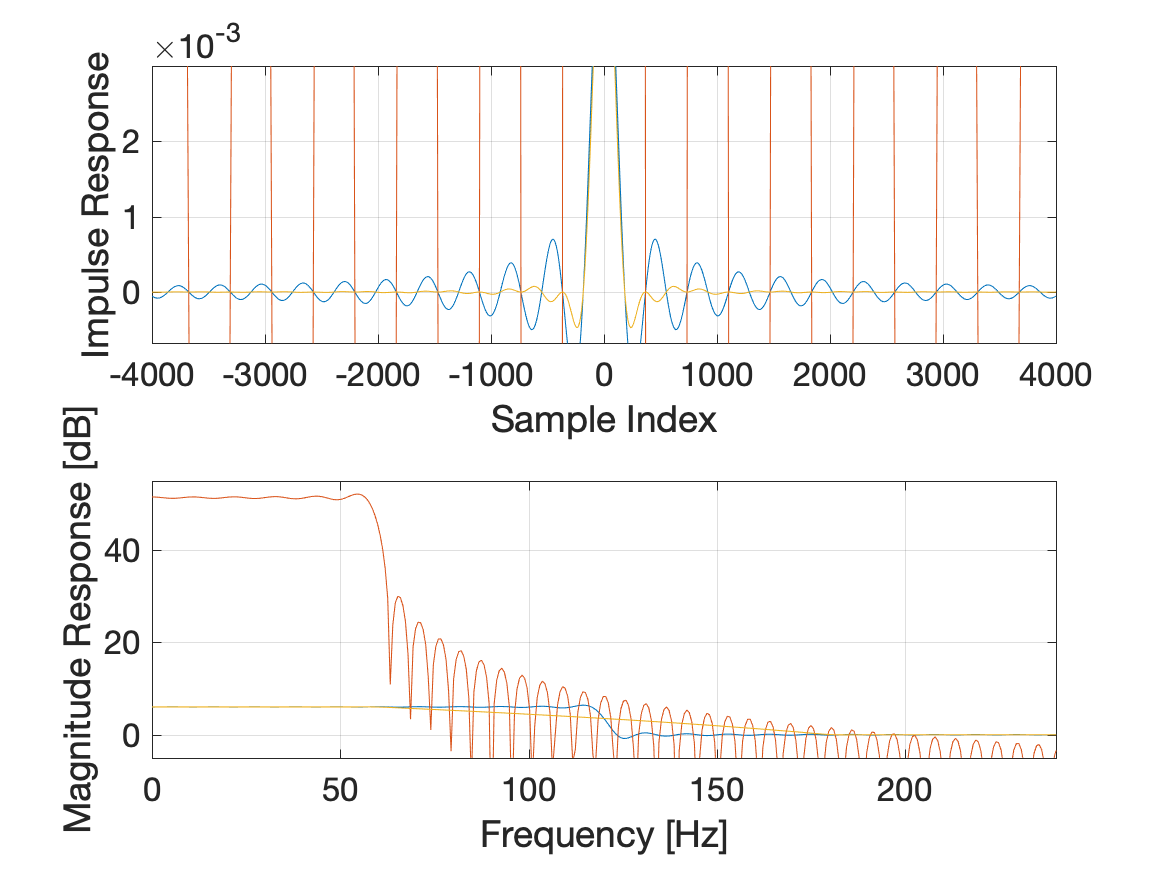
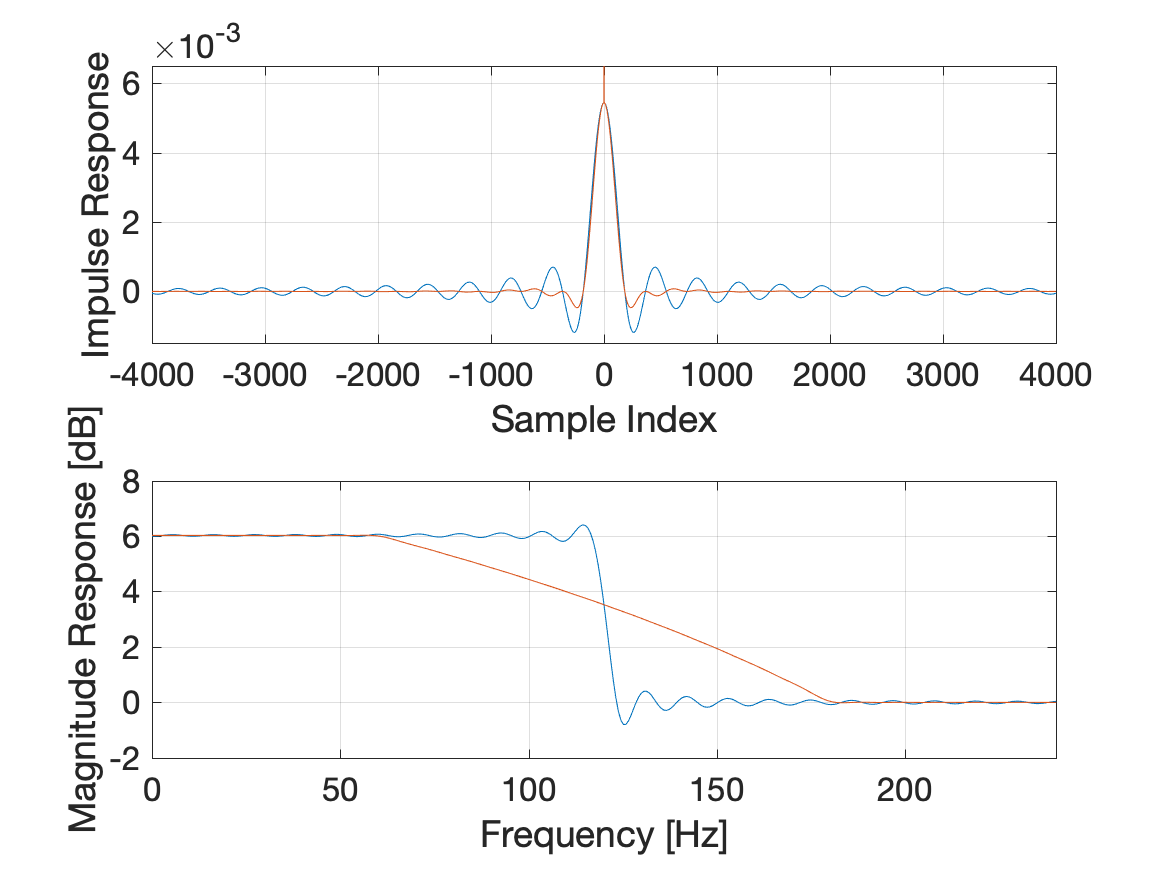
In the zoomed in magnitude response plot, the blue line is the magnitude response , where is the DTFT of , the truncated version of , an infinitely long sinc function. The truncation leads to the Gibbs effect (ringing) at frequencies near the cutoff frequency Hz. The orange line is , where is the DTFT of . As expected, shows a gradual transition between the boosted band and the unity gain band. This gradual transition is produced by multiplication of two functions in the time domain which leads to convolution in the frequency domain.