Discrete-Time Signals Questions
Consider the signal
where
 What is the dimension? What is the number of channels?
Let a signal be defined as follows:
where
![Line drawing for x[n] and y[n].](./line_drawing/line_drawing_xy.png)
Characterize this signal in terms of:
Domain (continuous or discrete)
Range (continuous or discrete)
Dimension (number of independent variables)
Channels (number of dependent variables)
By the way, when the
![xy-plot using the signals x[n] and y[n] from above.](./line_drawing/line_drawing.png)
And that is reminiscent of this photograph.

As we expect for a discrete-time signal, the values in this two-channel sequence could be recorded in a table. In this case, there are 1887 sample pairs in this sequence. The signal is not defined for
| 0 | -9.498571 | -12.246974 |
| 1 | -9.479775 | -11.973078 |
| 2 | -9.342982 | -10.885026 |
| 3 | -9.248042 | -10.400676 |
| 4 | -9.194618 | -10.154325 |
| 1885 | 7.253519 | -8.727917 |
| 1886 | 7.328393 | -8.677964 |
Consider the signal waveform pictured below in which the samples
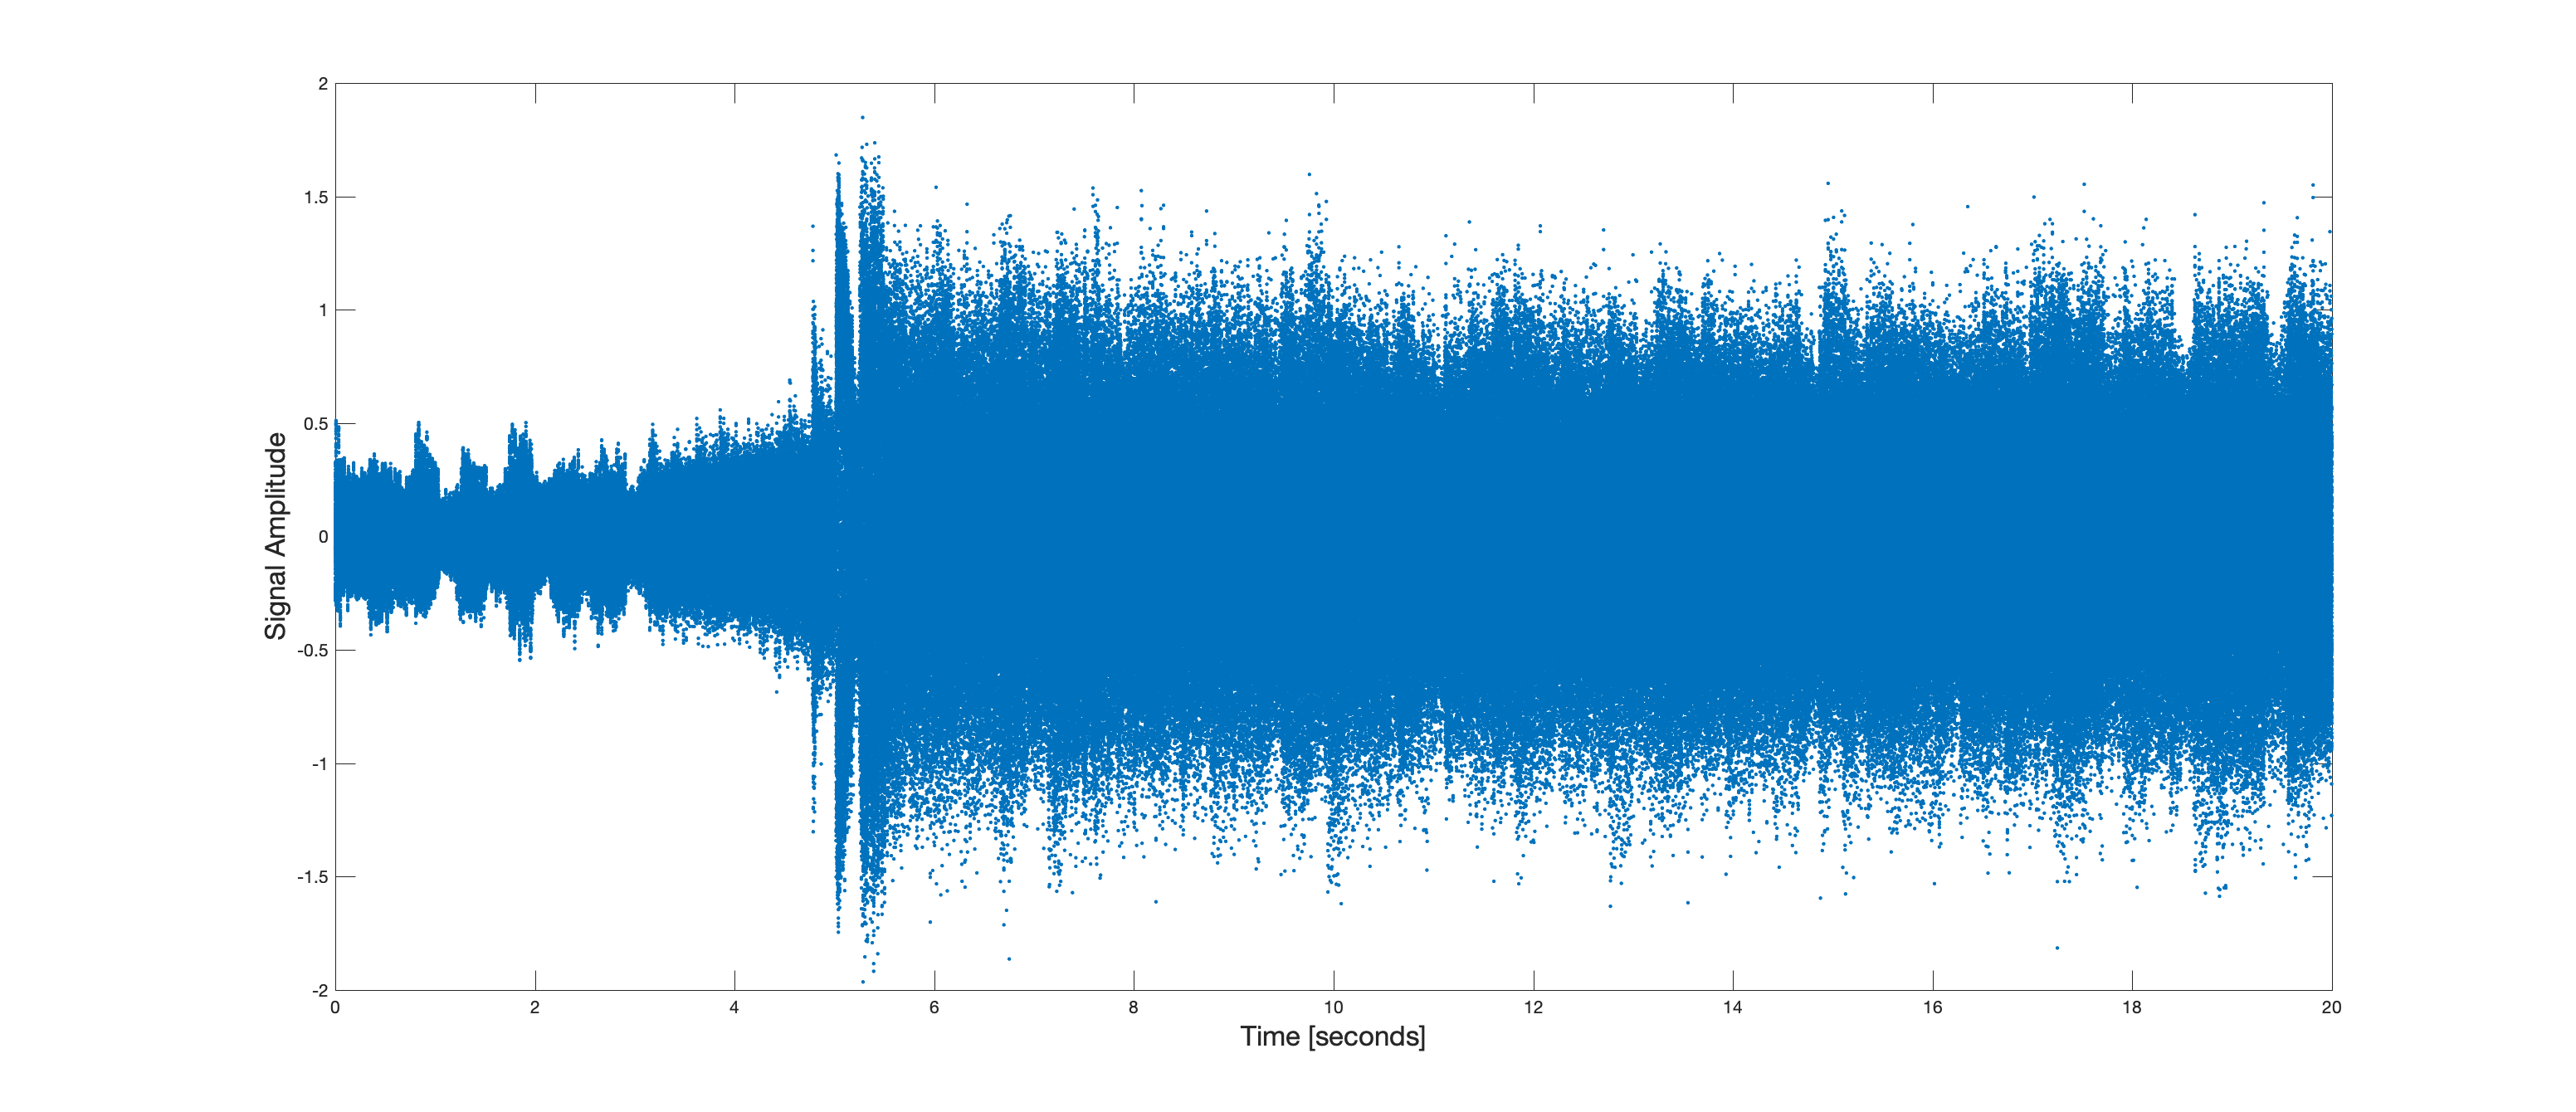
You can hear the audio by clicking here and the slow version. This is the song "Language" by Porter Robinson. You can listen to the full song on YouTube.
Characterize this signal in terms of:
Domain (continuous or discrete)
Range (continuous or discrete)
Dimension (number of independent variables)
Channels (number of dependent variables)
By the way, here is the spectrogram of this segment of the signal. The spectrogram exposes the manner in which signal energy is distributed over time and frequency.
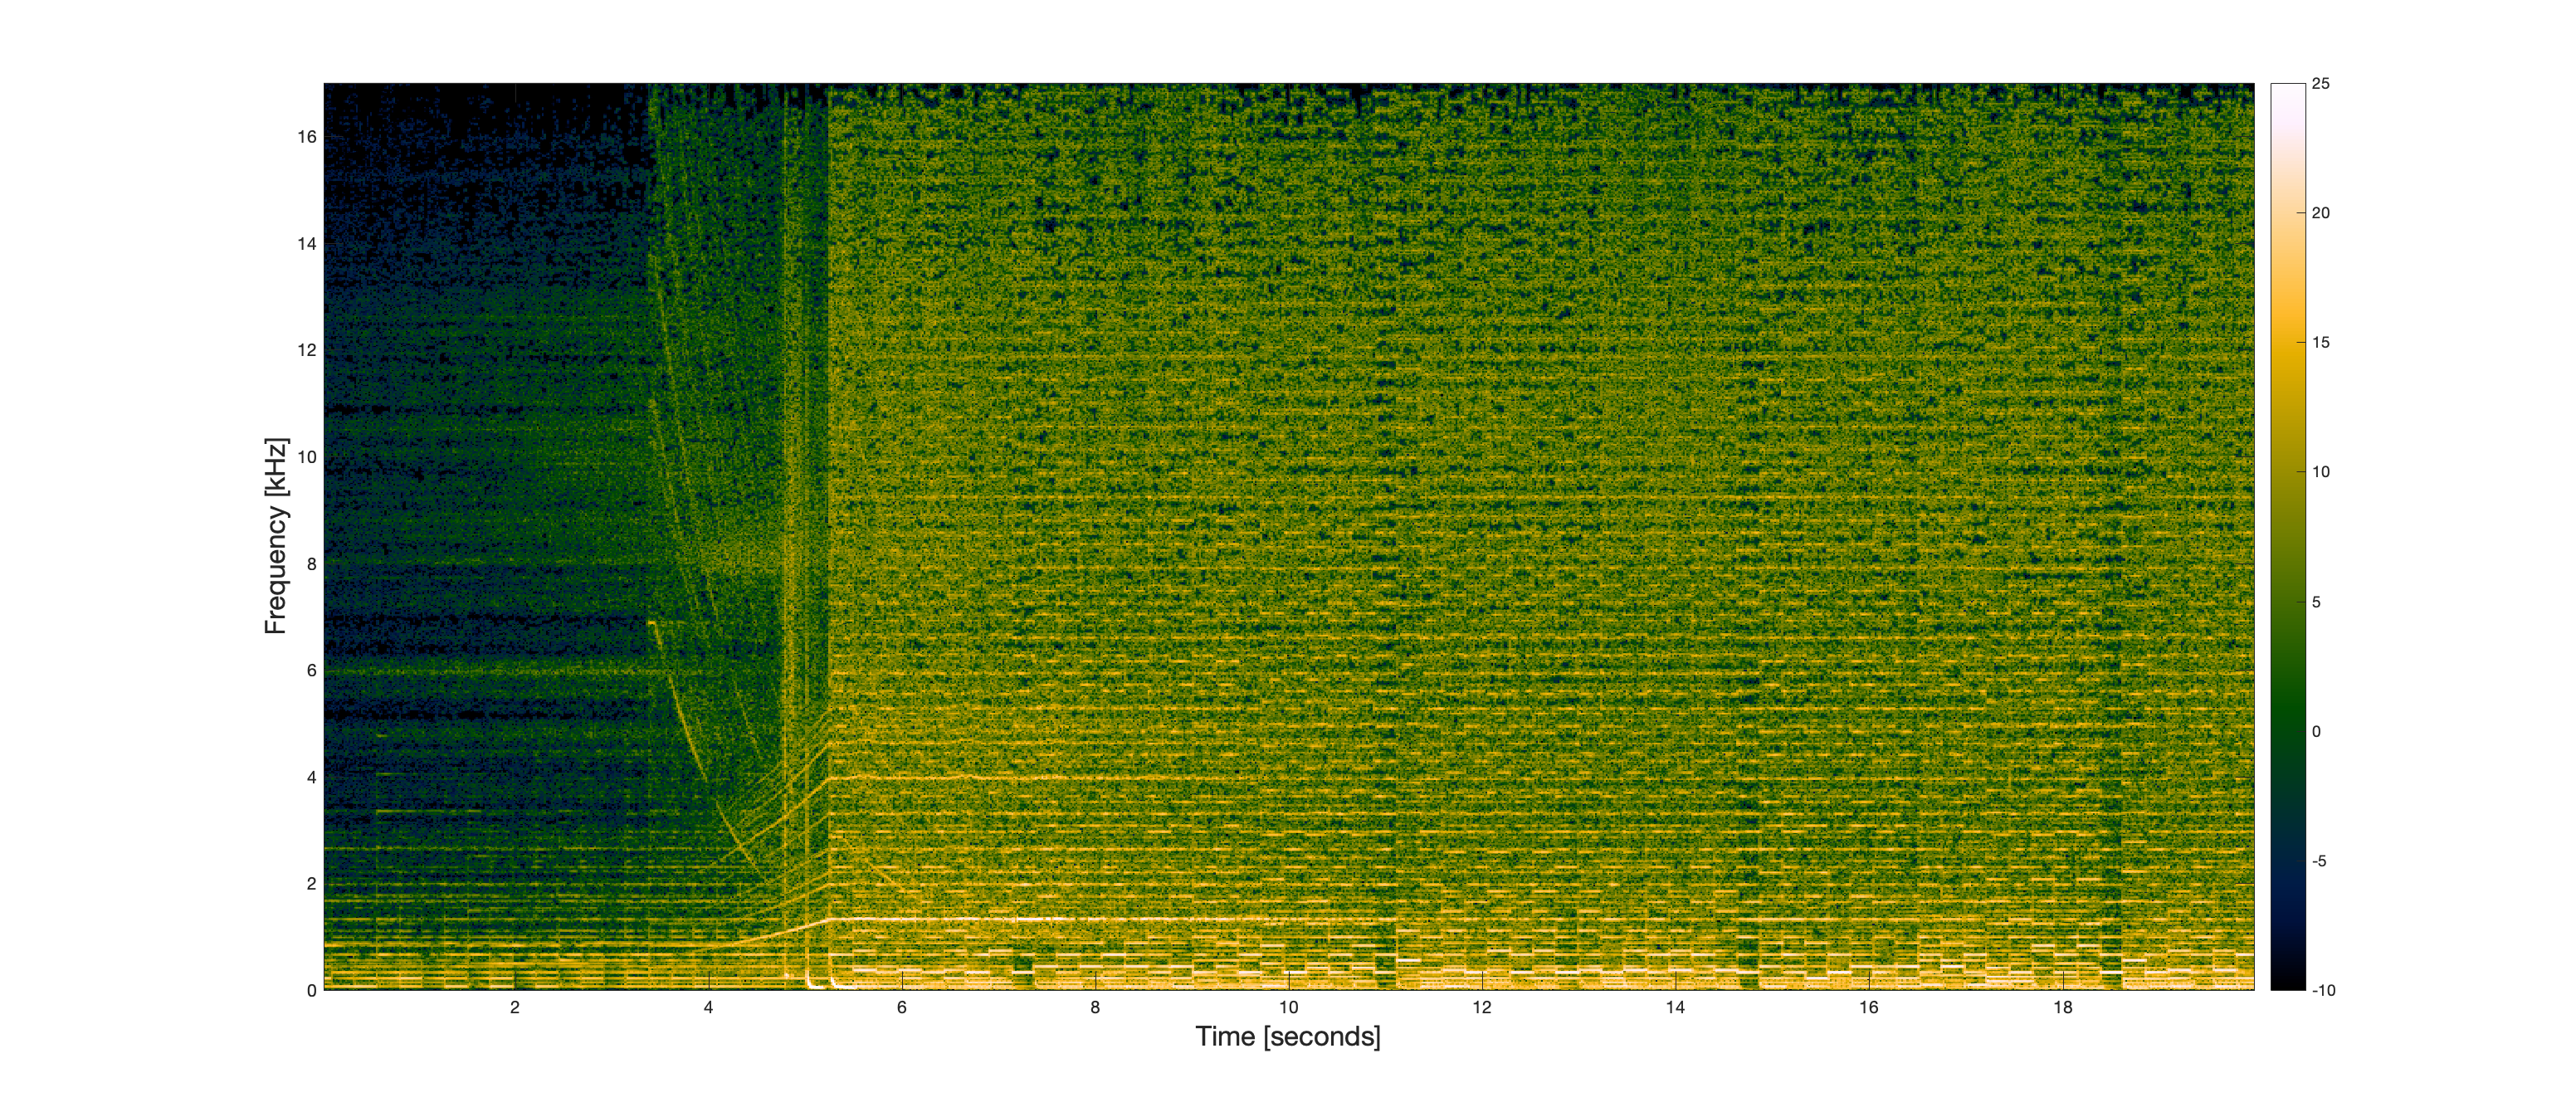
When you listen to the signal, you can hear the structures that can be seen in the spectrogram. You can see the notes more easily by looking at just the first two kilohertz of frequency.
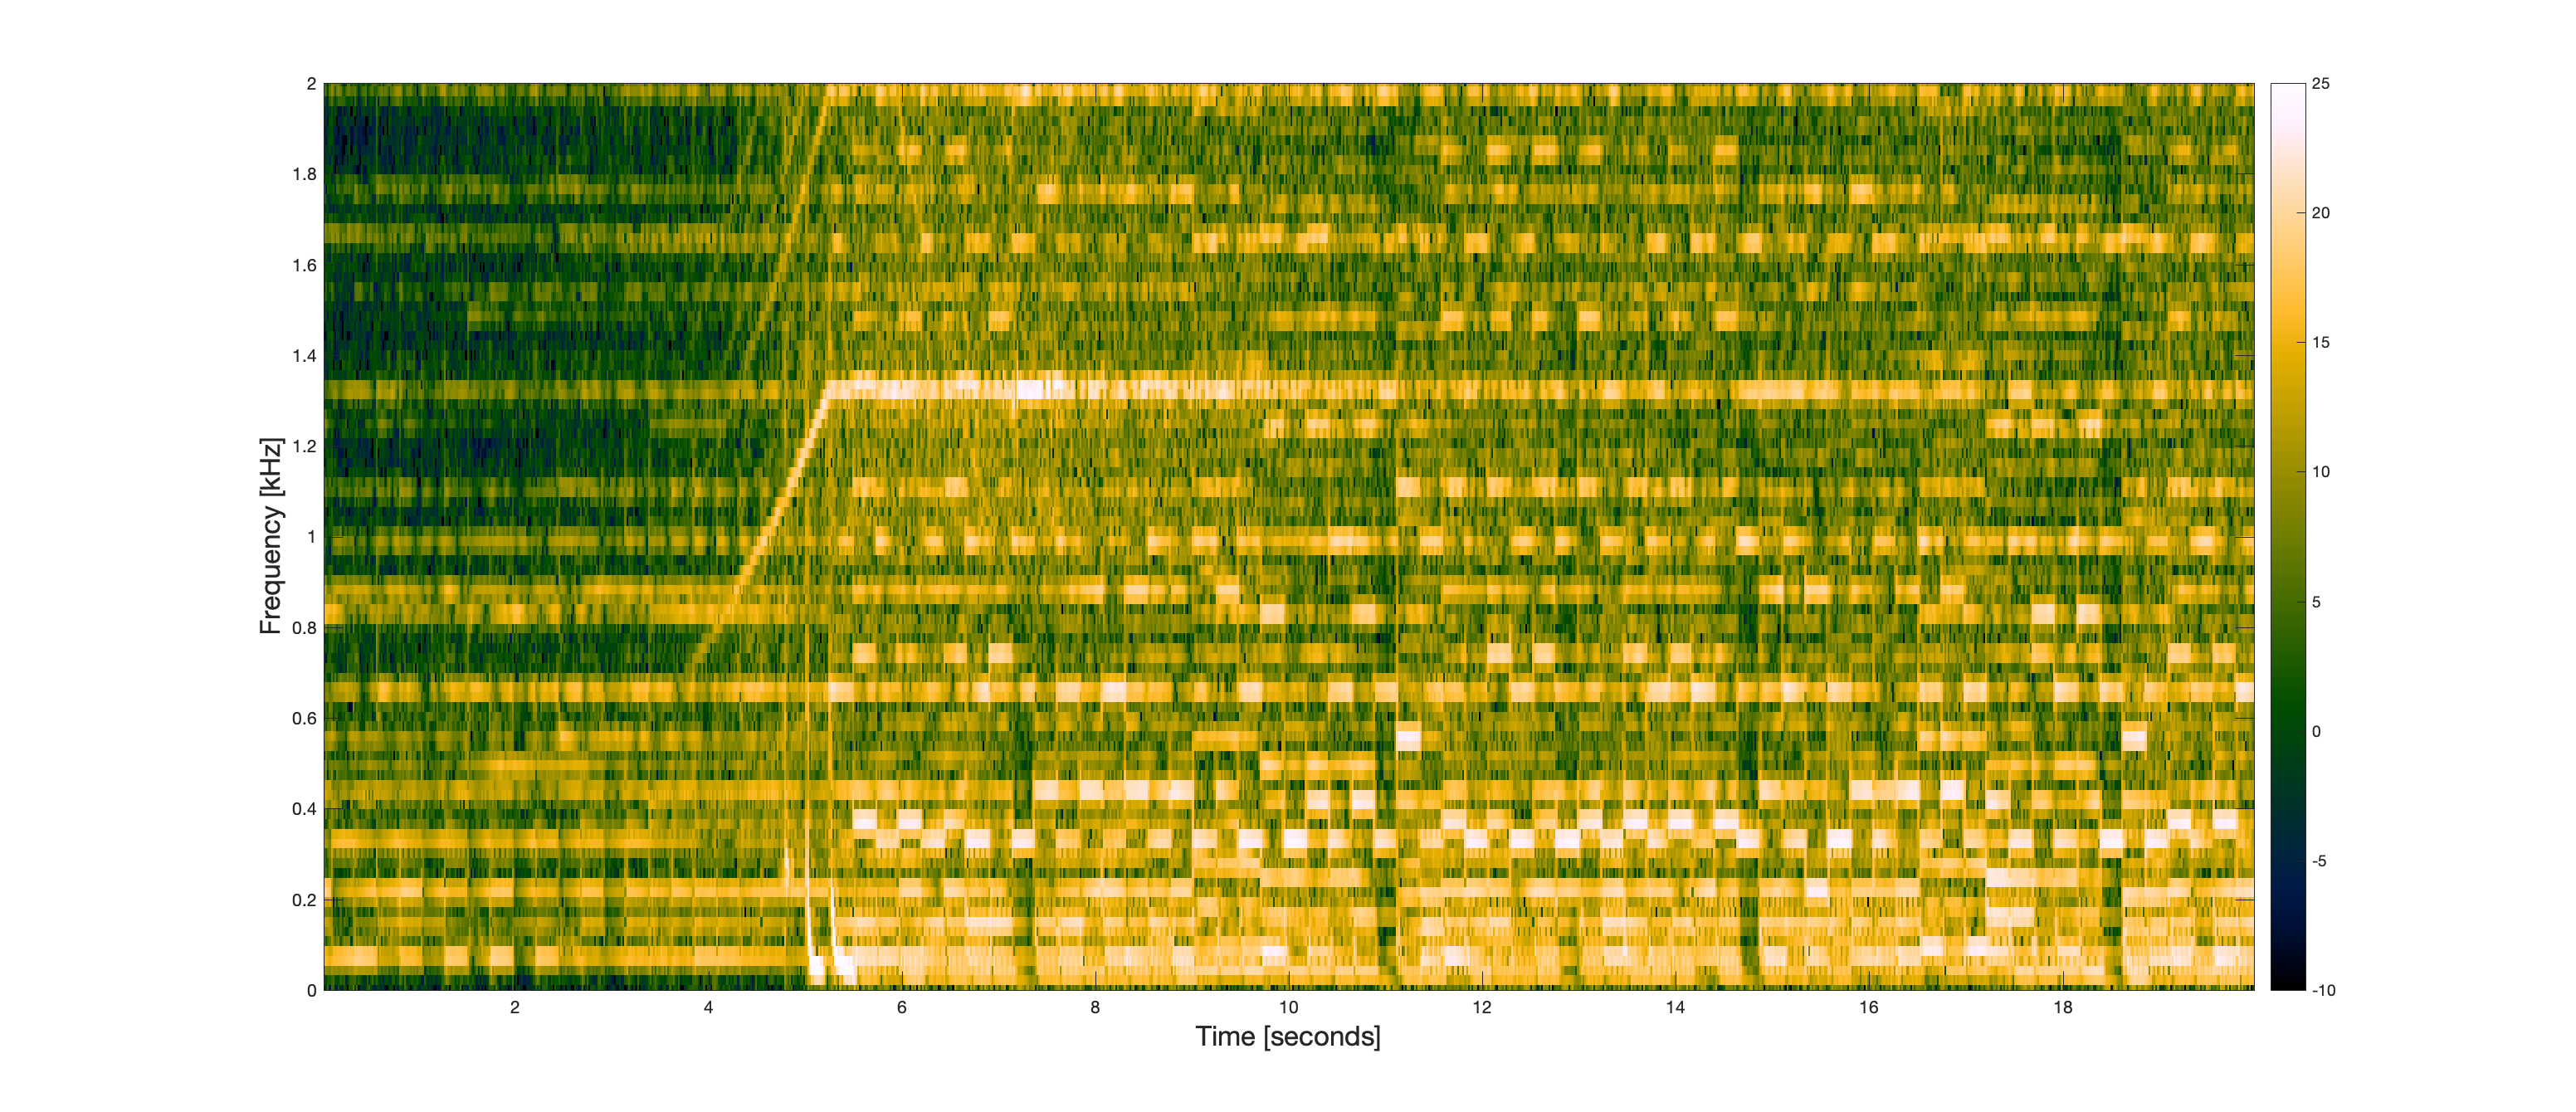
Here are seconds 5 through 12.
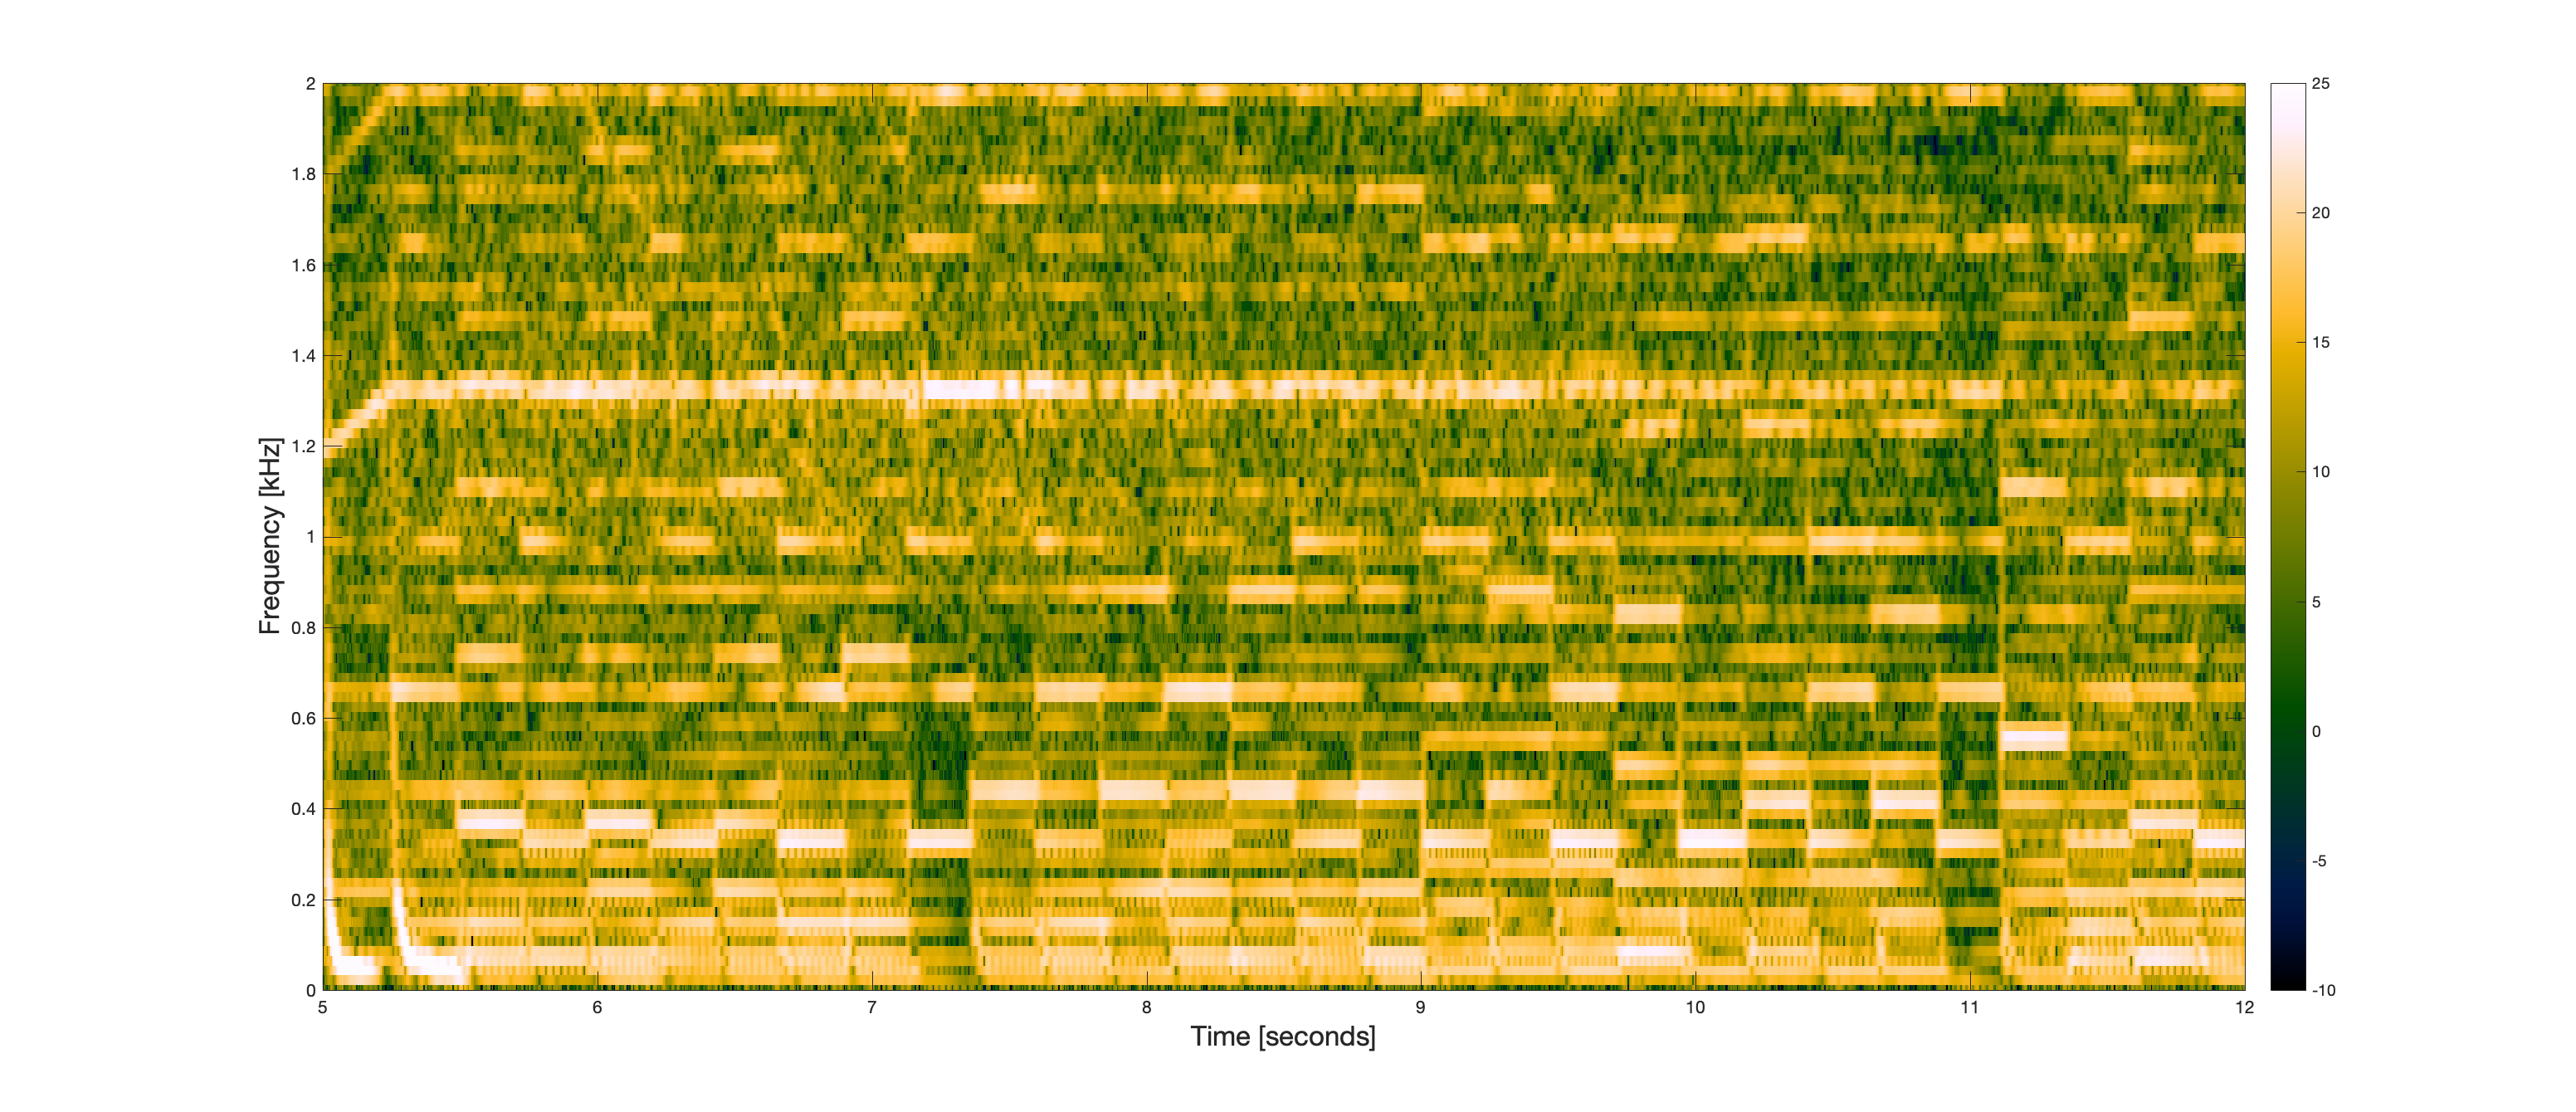
Notice the falling frequency characteristic of the drums at the start of this segment. This can be visualized in the time domain as well.
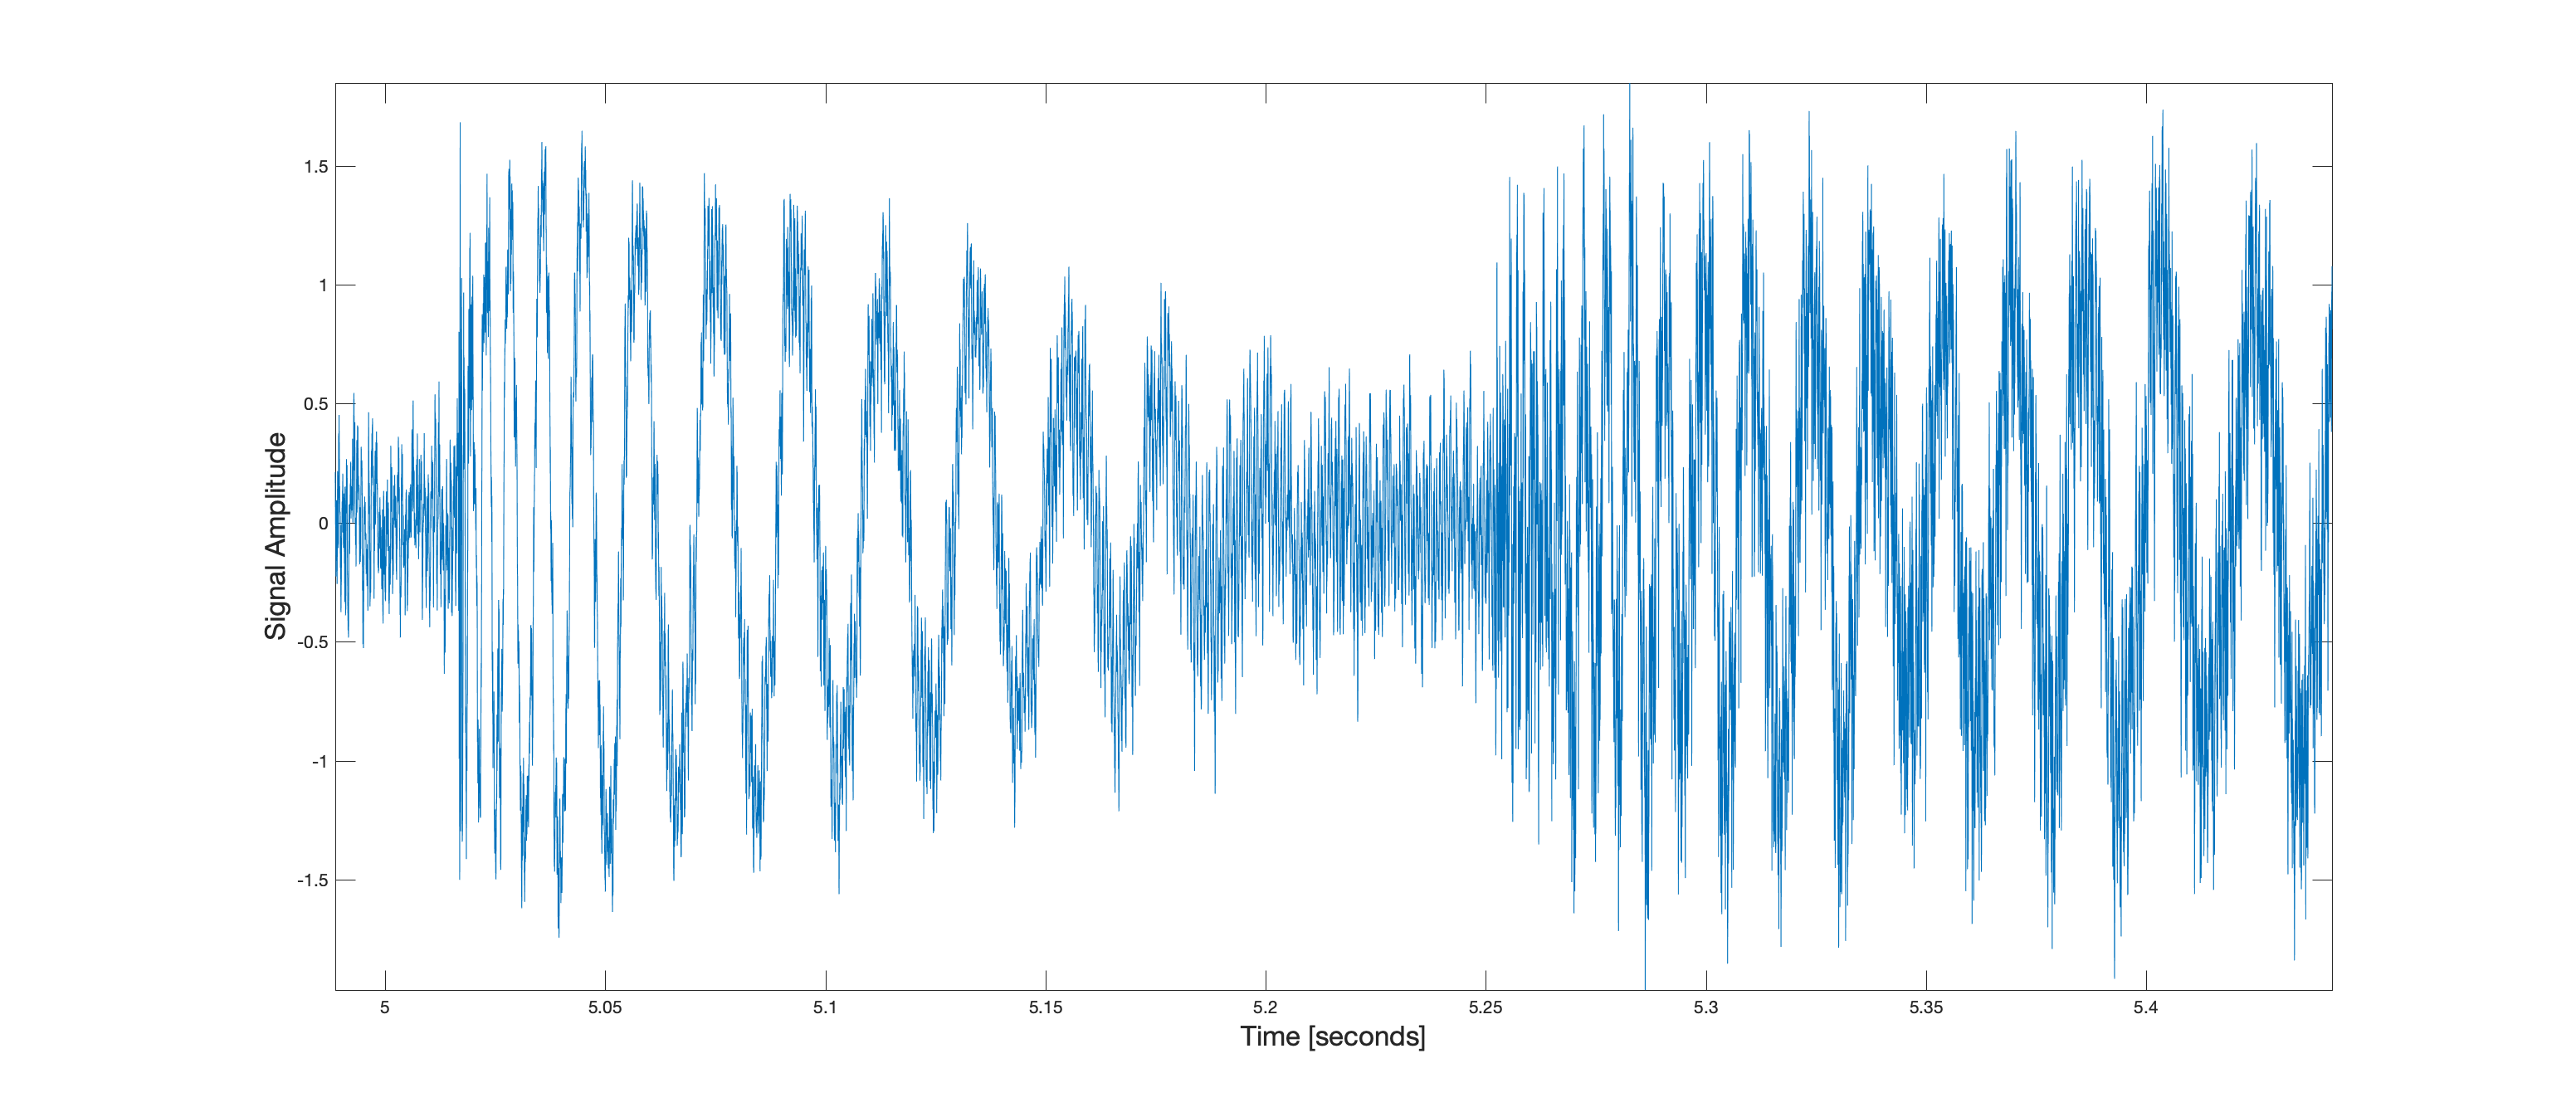
You can see the frequency falling from high to low in the waveform.
This video is a signal. Characterize this signal in terms of:
Domain (continuous or discrete)
Range (continuous or discrete)
Dimension (number of independent variables)
Channels (number of dependent variables)
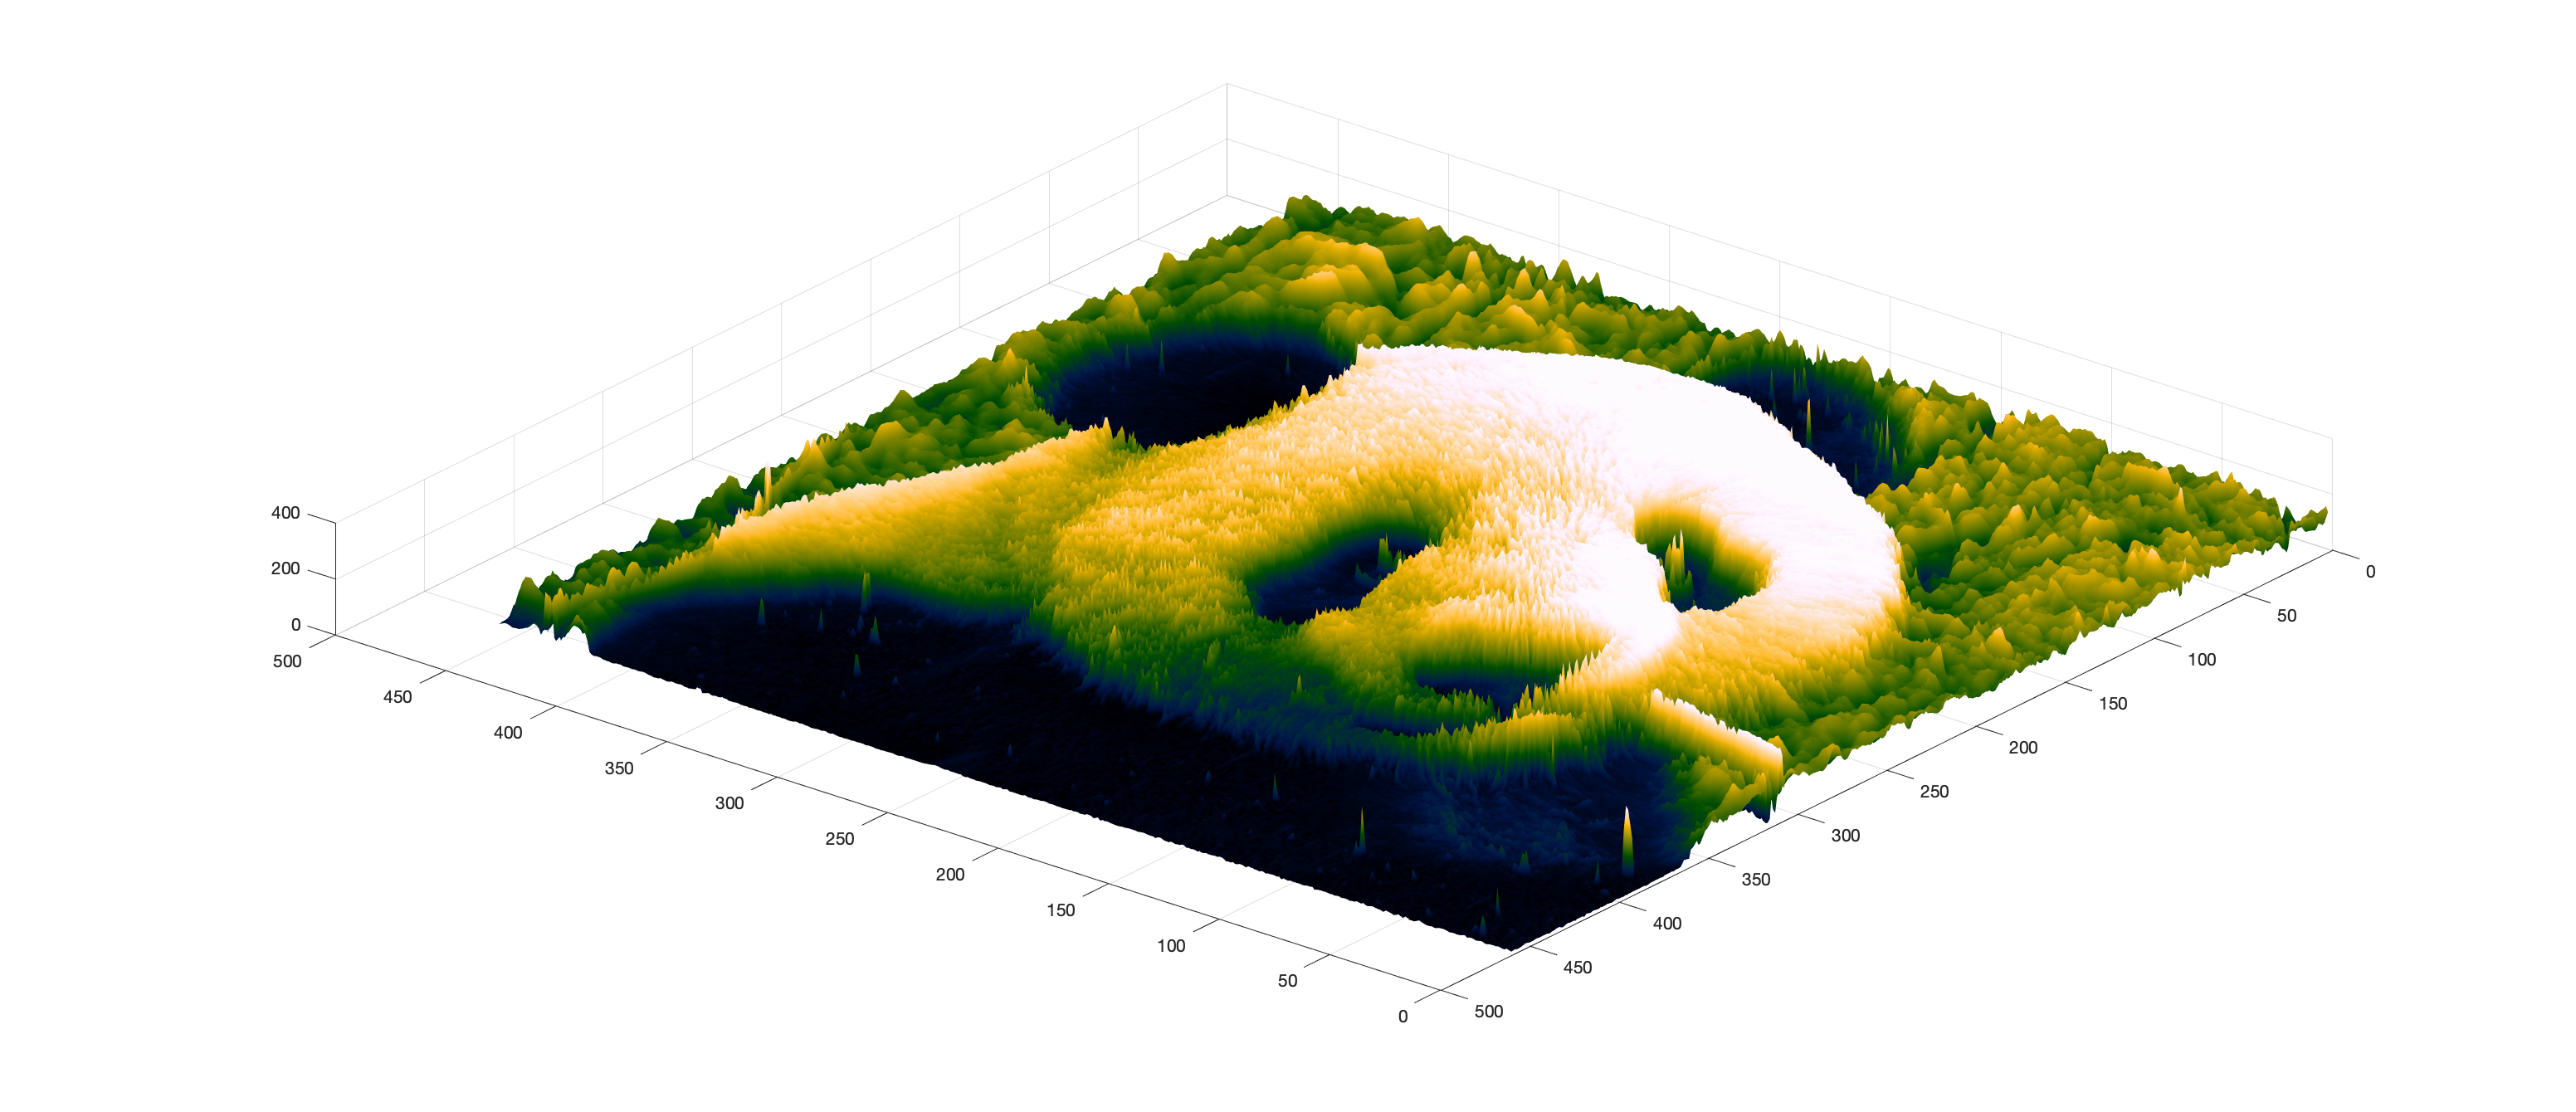
The image below is a signal.

Characterize this signal in terms of:
Domain (continuous or discrete)
Range (continuous or discrete)
Dimension (number of independent variables)
Channels (number of dependent variables)
To illustrate that this picture reall is a function of two independent variables, consider a surface plot of the same image.
Convolution with delayed impulses leads to delayed replicas of a signal. Consider the five audio signals shown below.
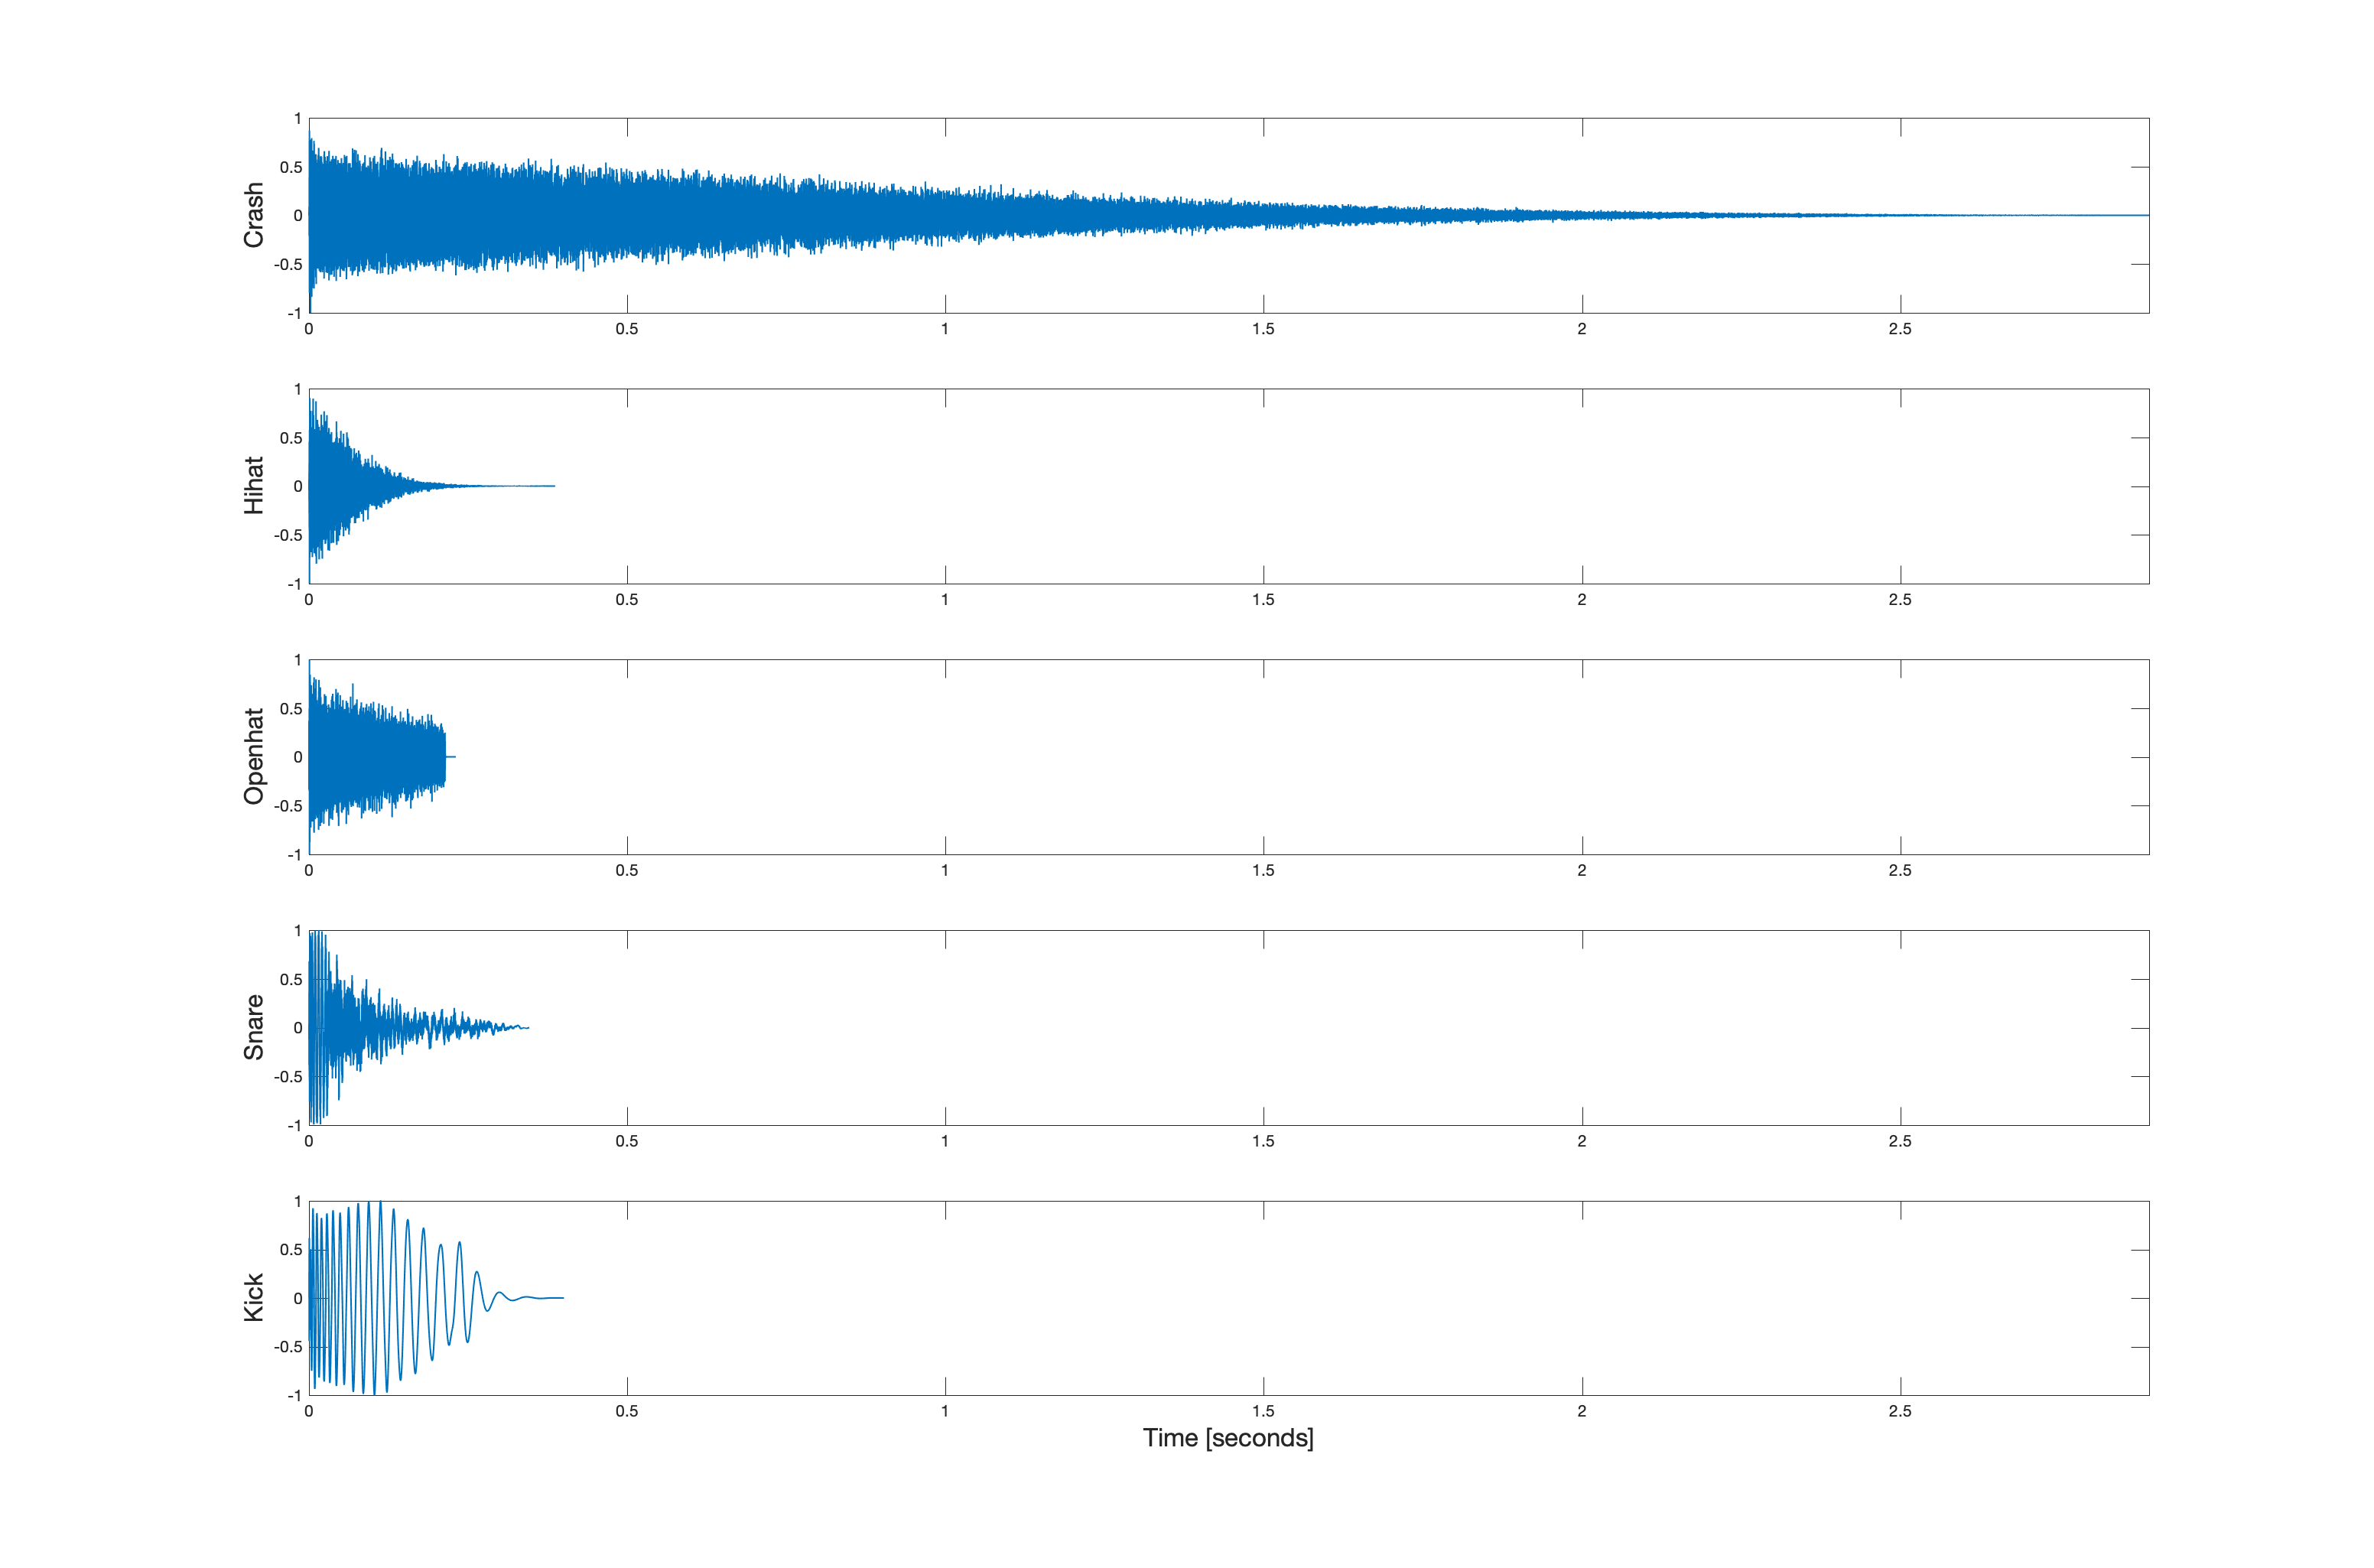
These signals sound like this: crash, hihat, openhat, snare, and kick.
Suppose these five signals are convolved (respectively) with the five impulse patterns shown below.
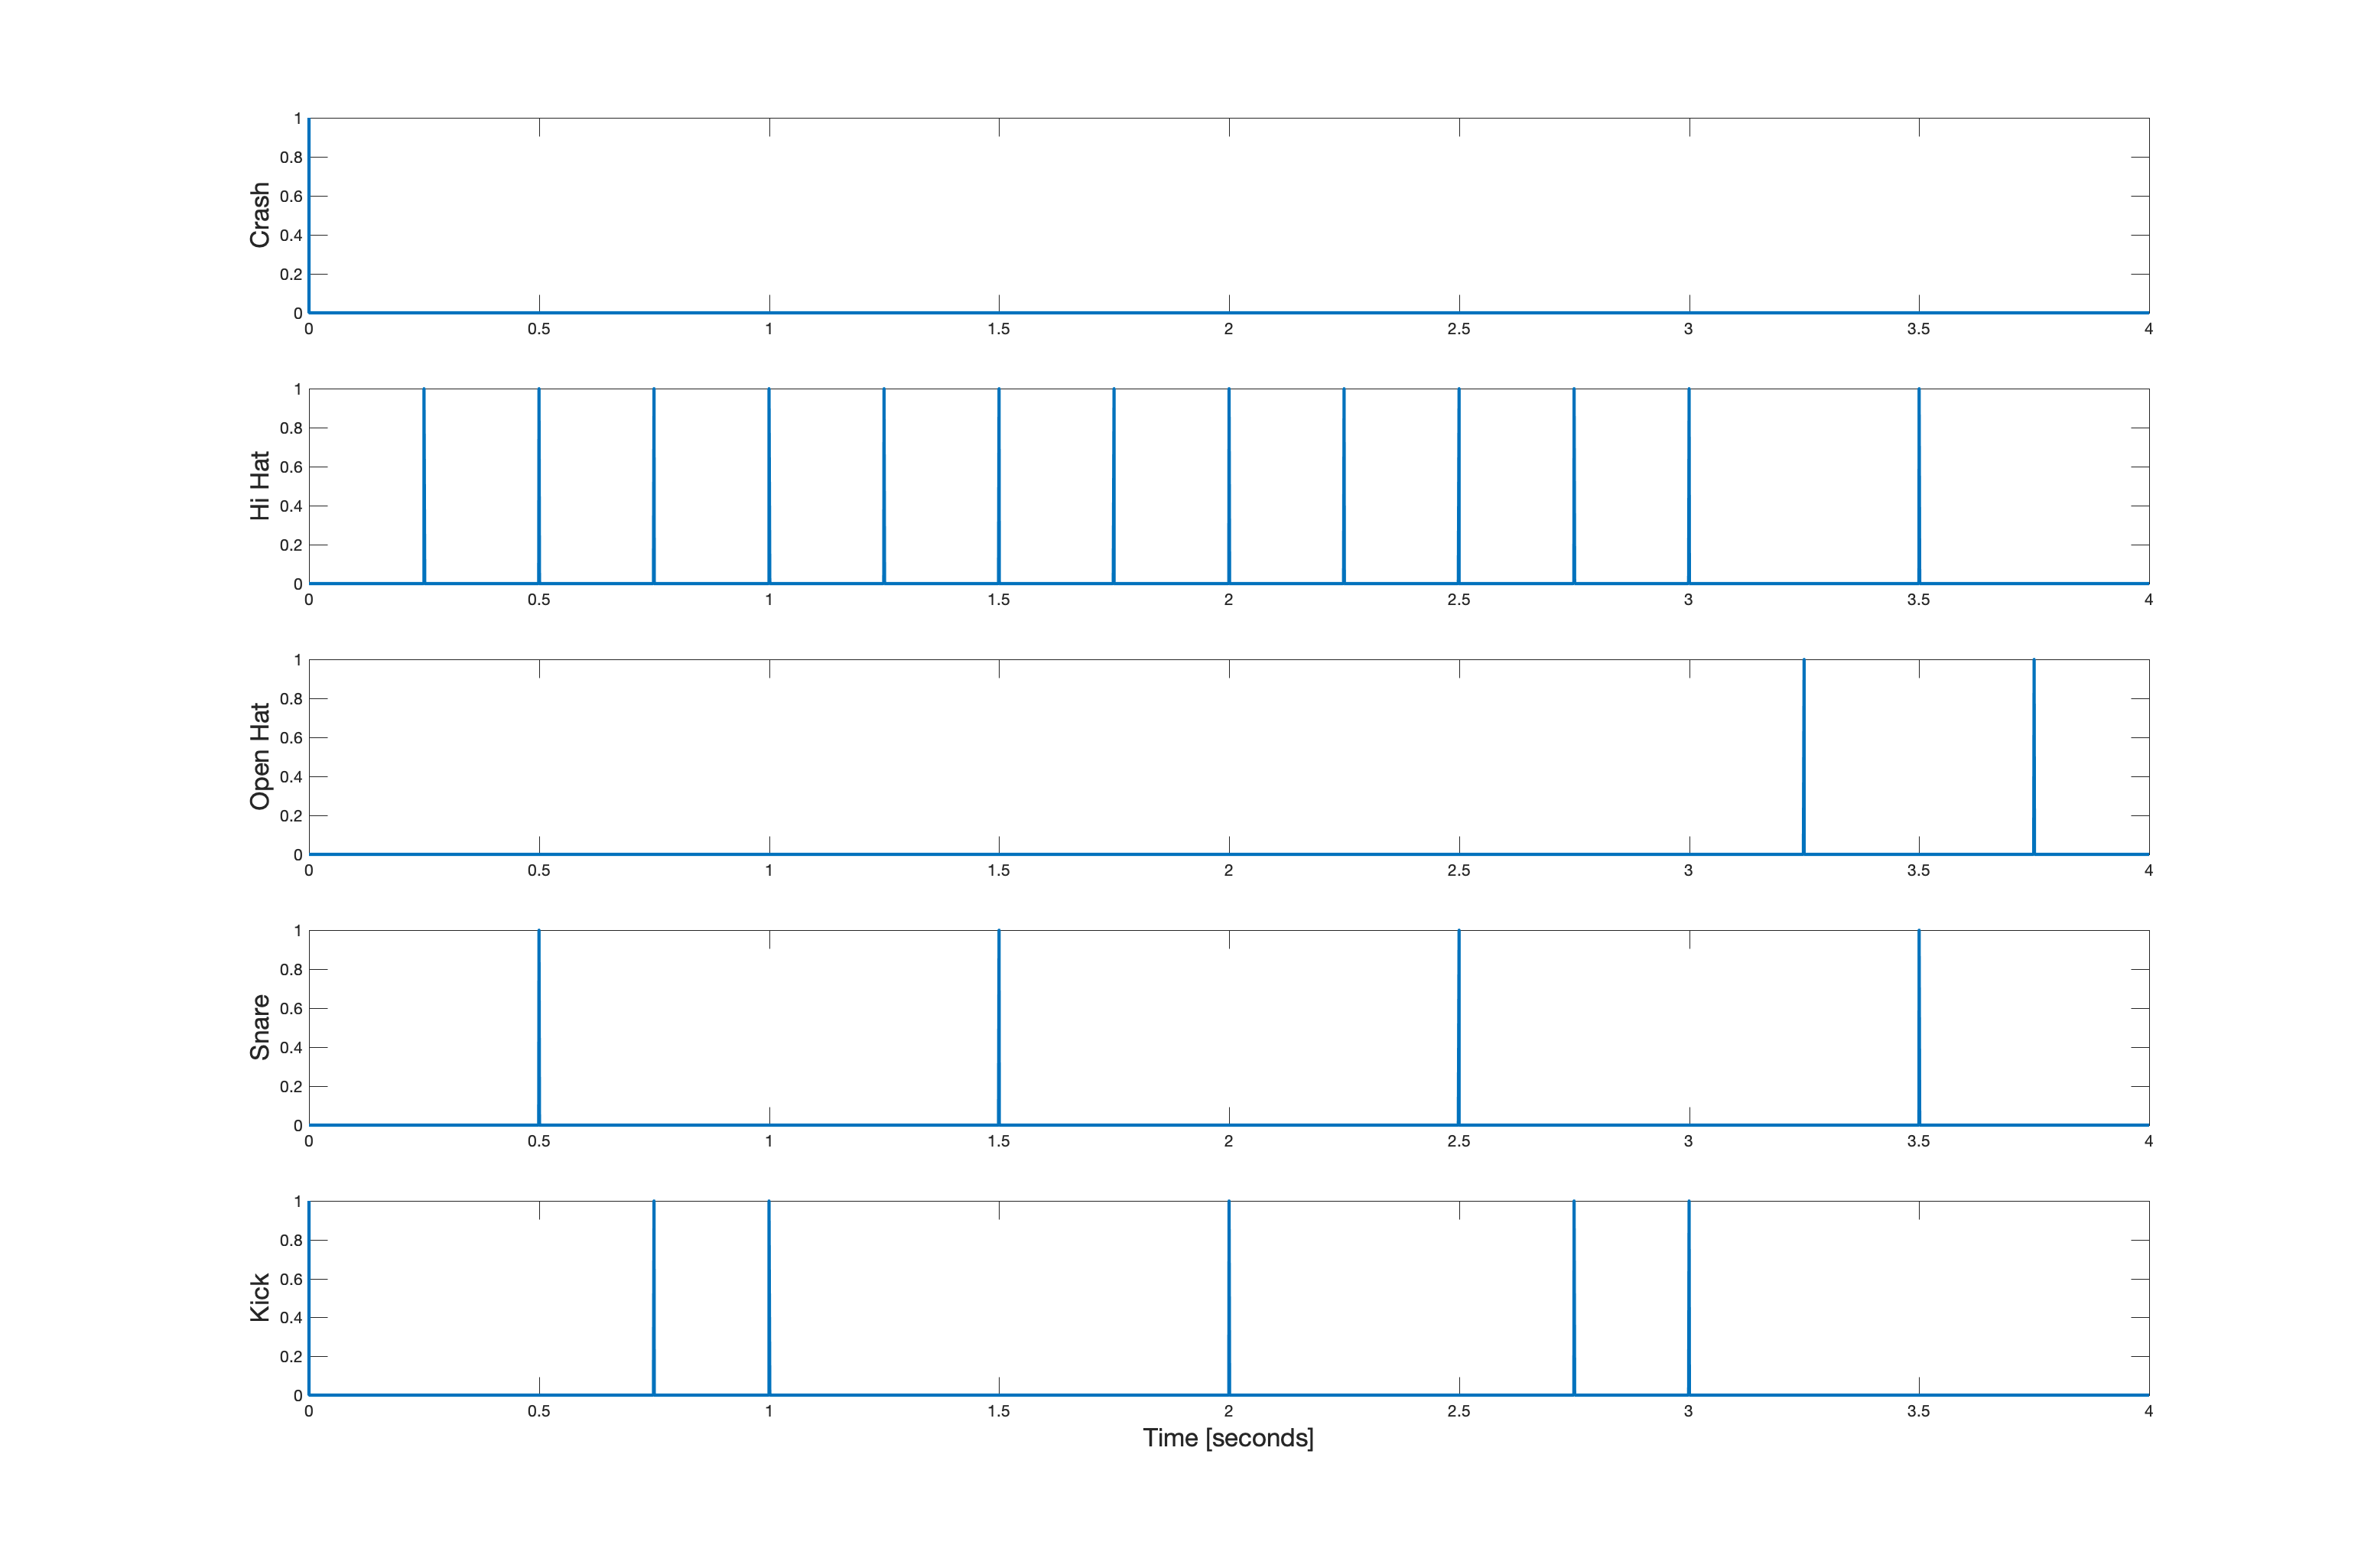
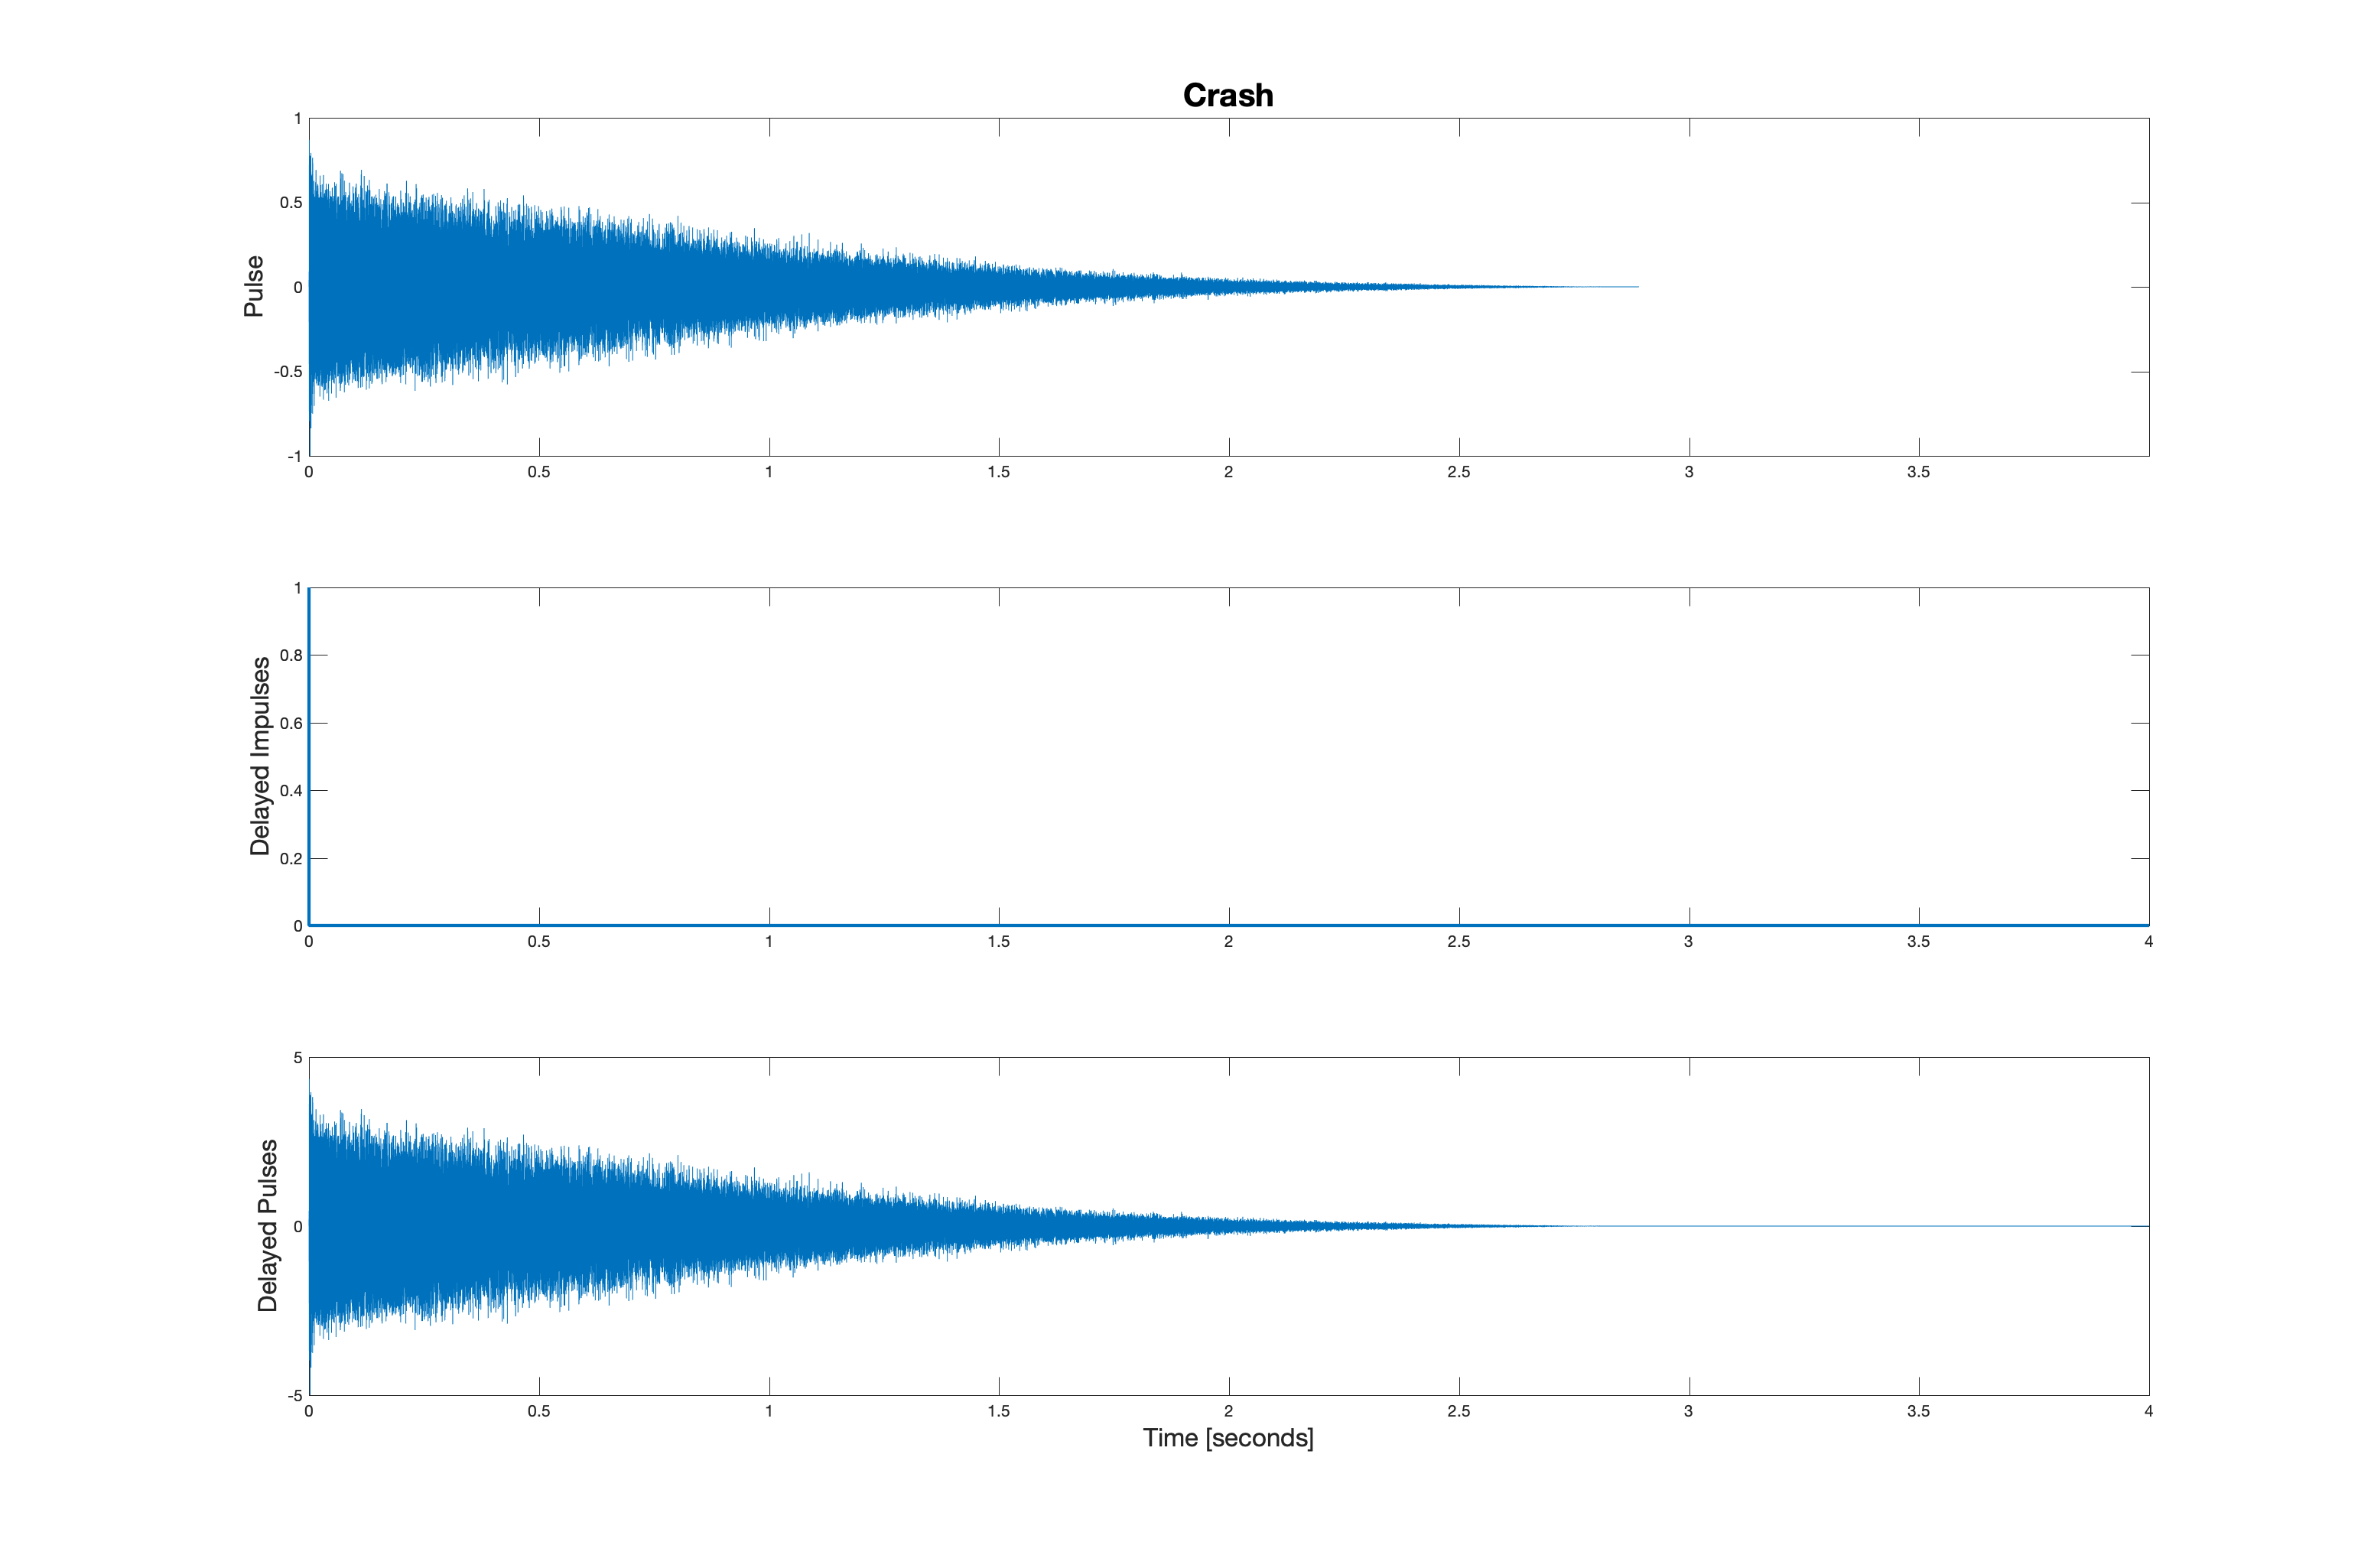
Let's consider each case separately. First the crash sound. This one is not very interesting because there is only one delta function and it is positioned at the origin
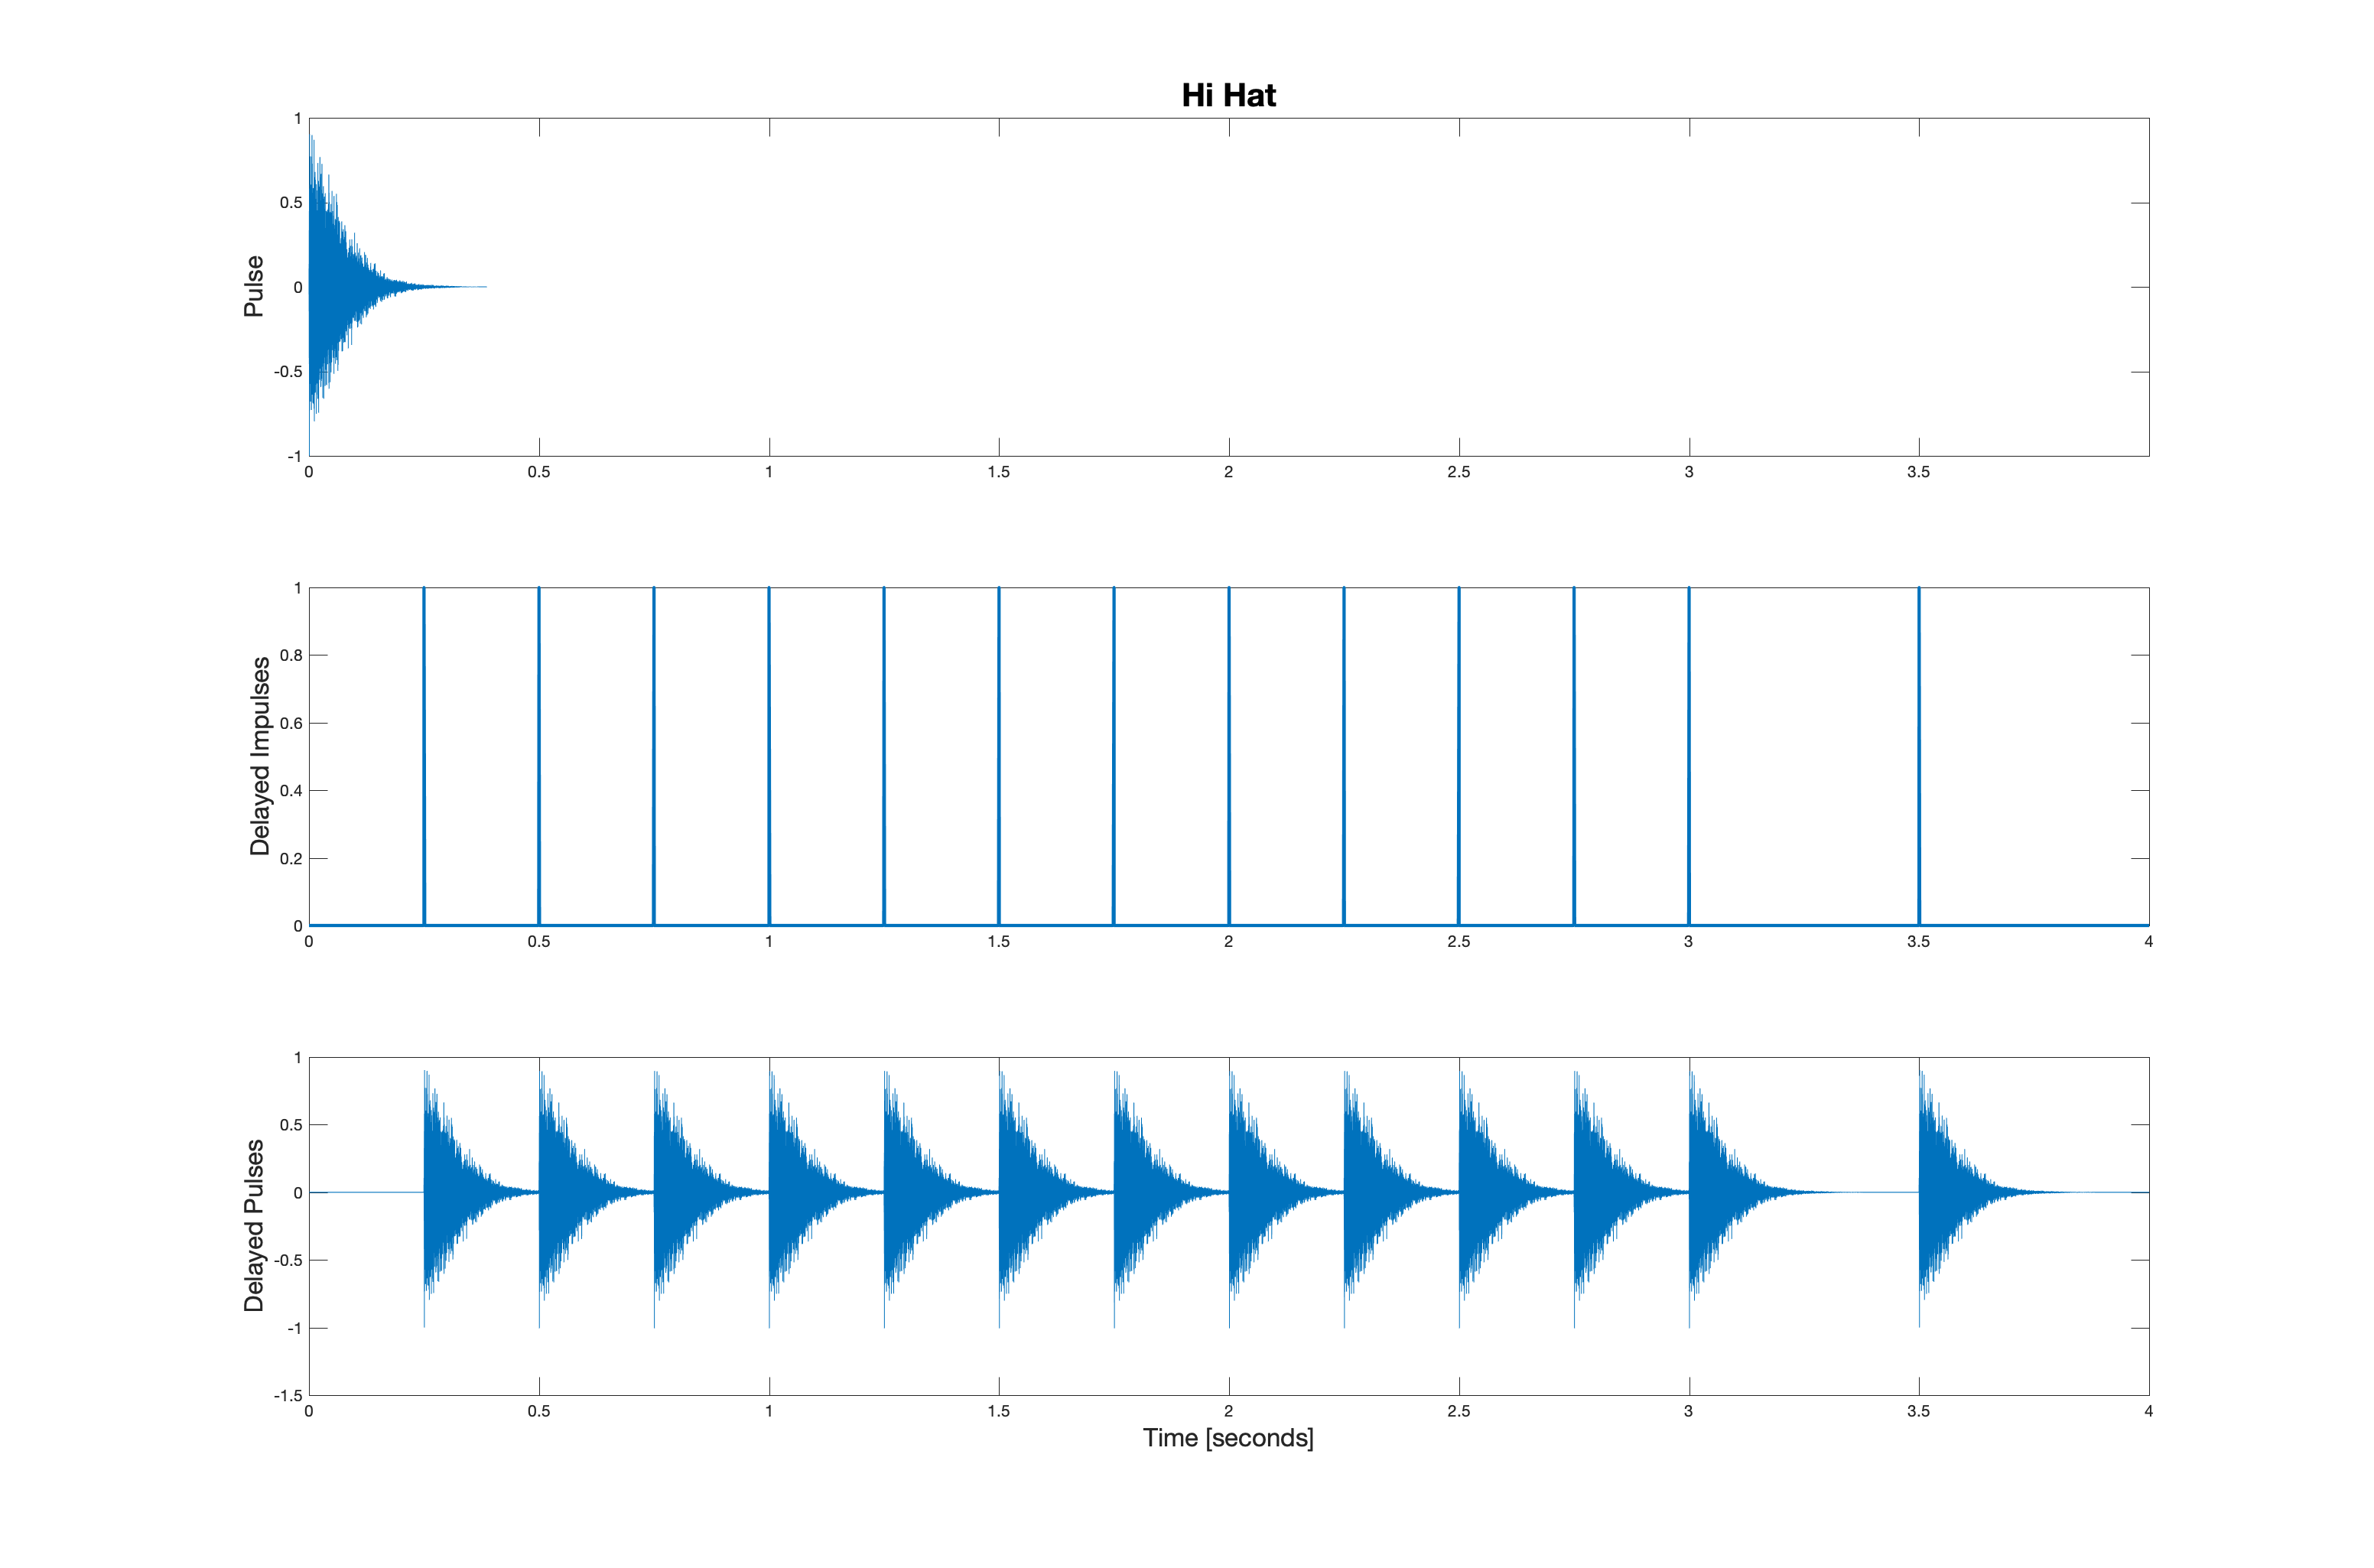
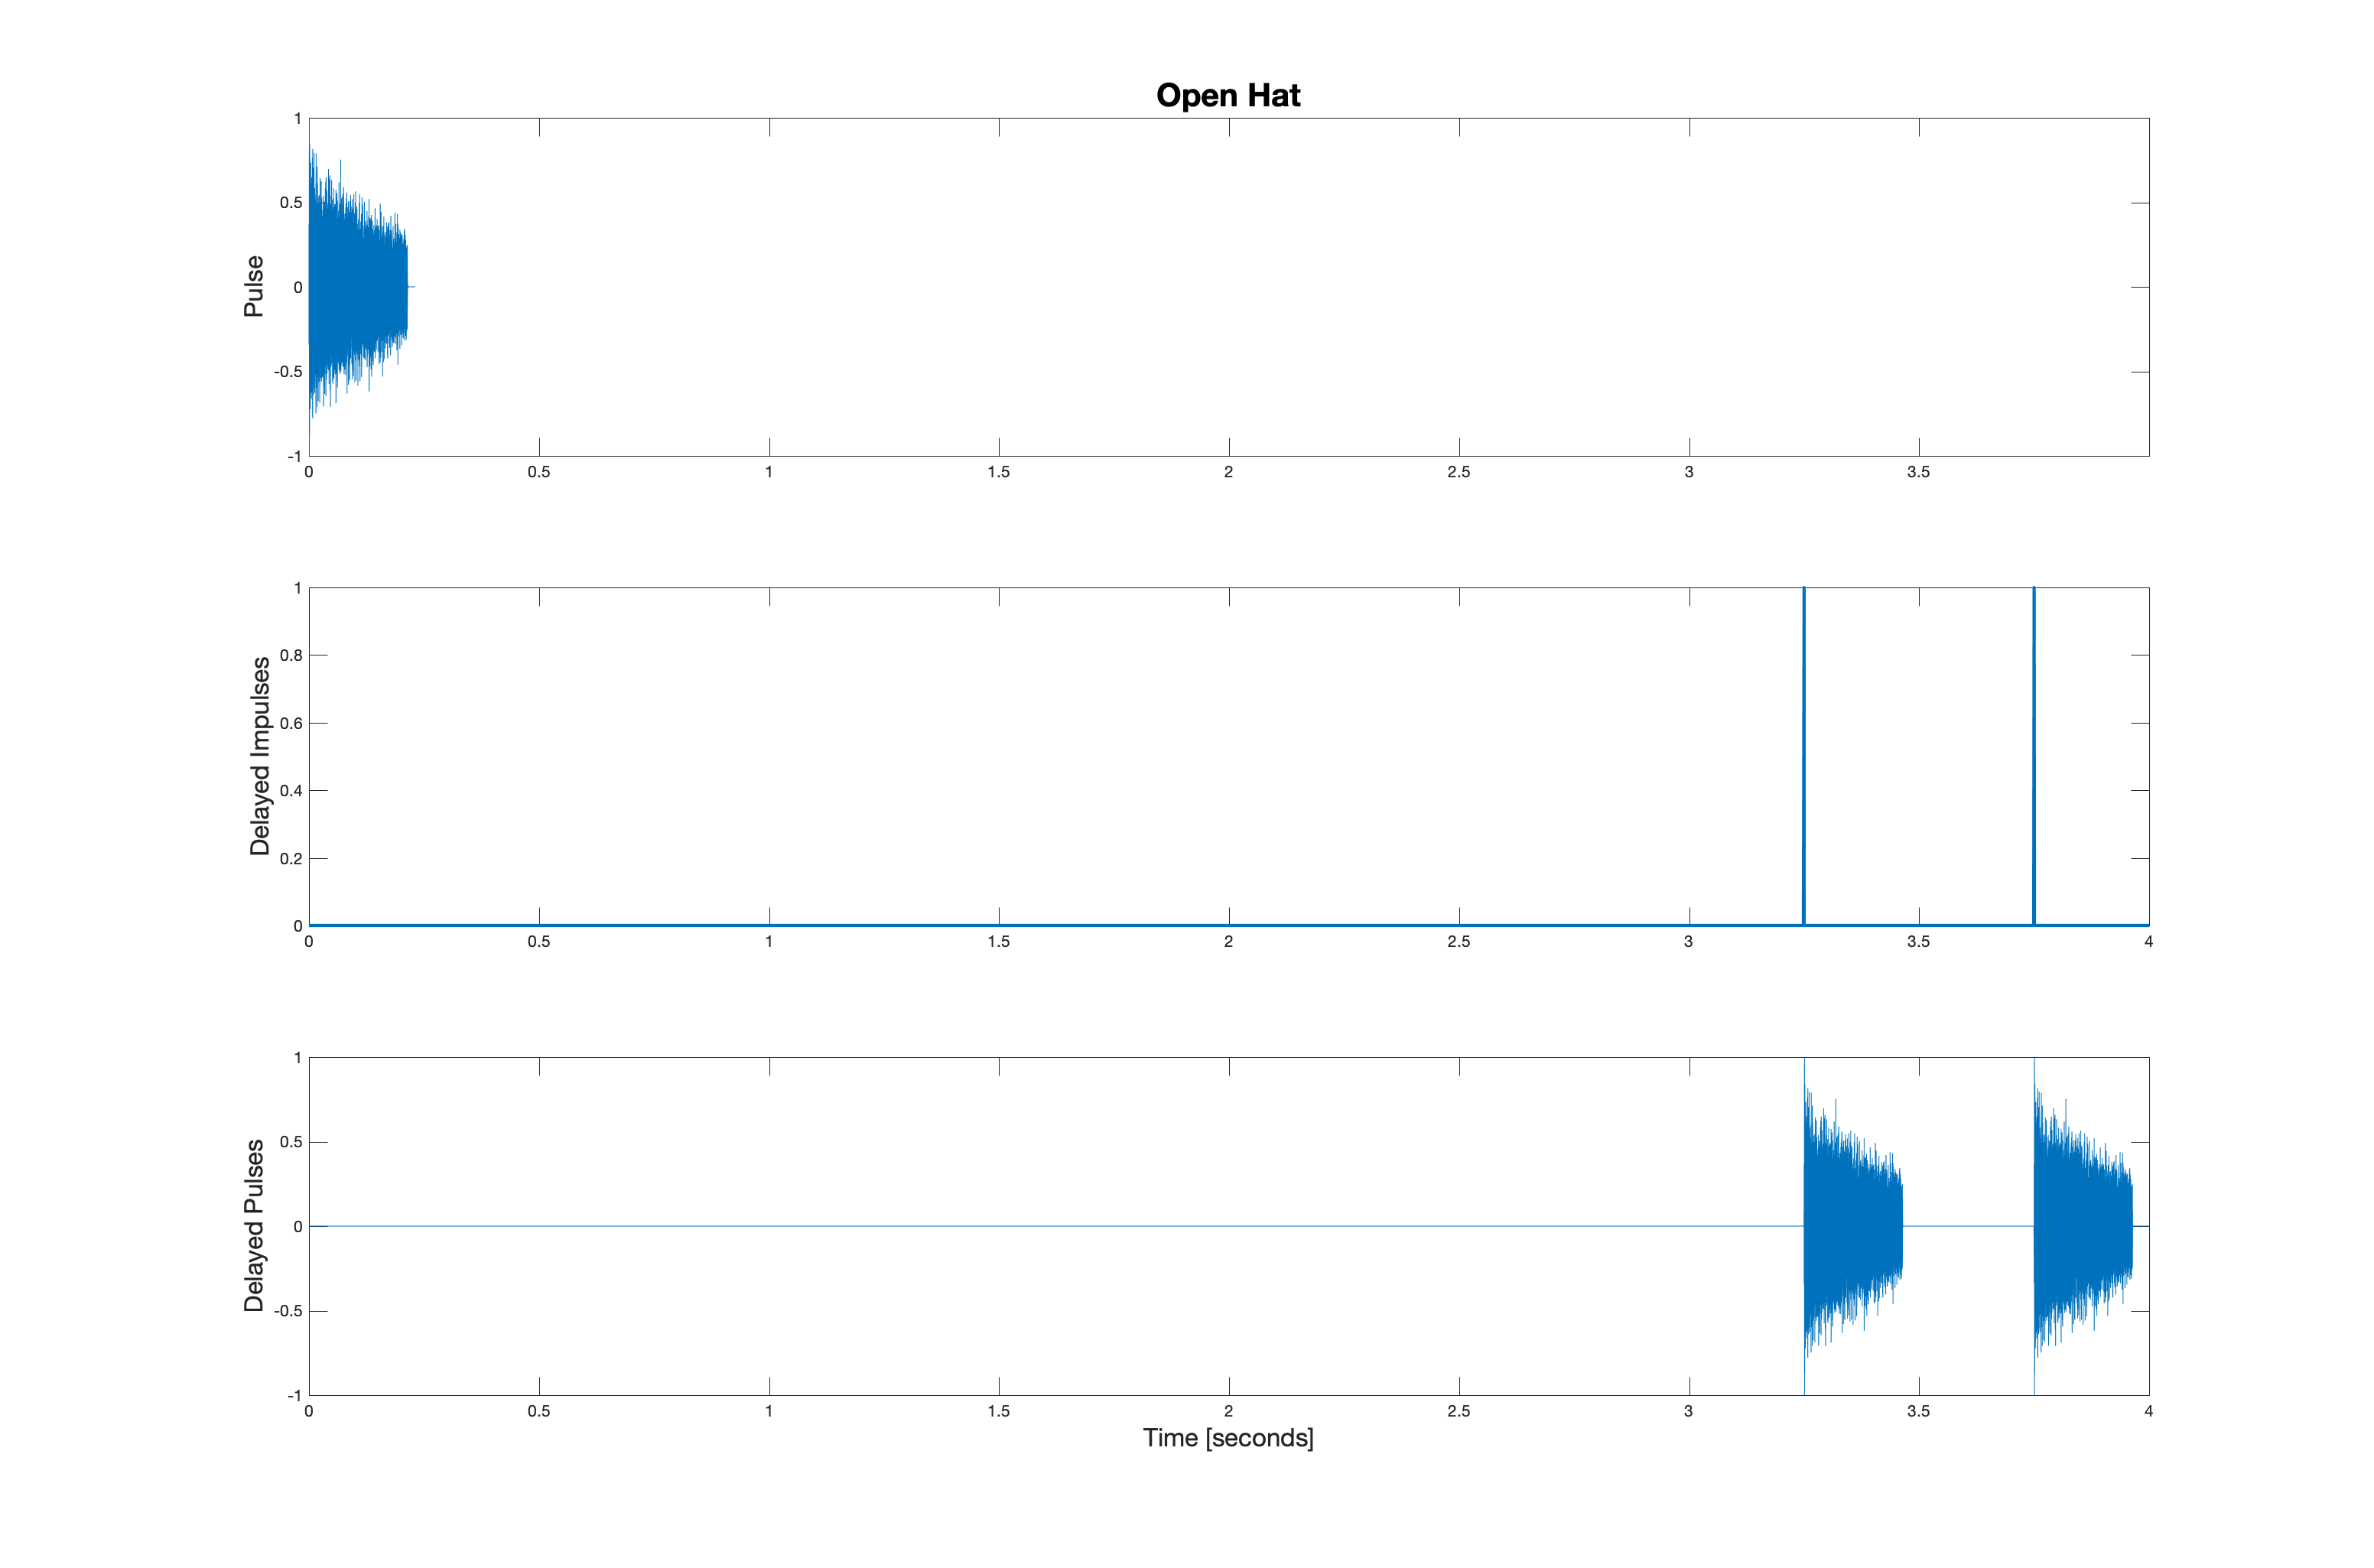
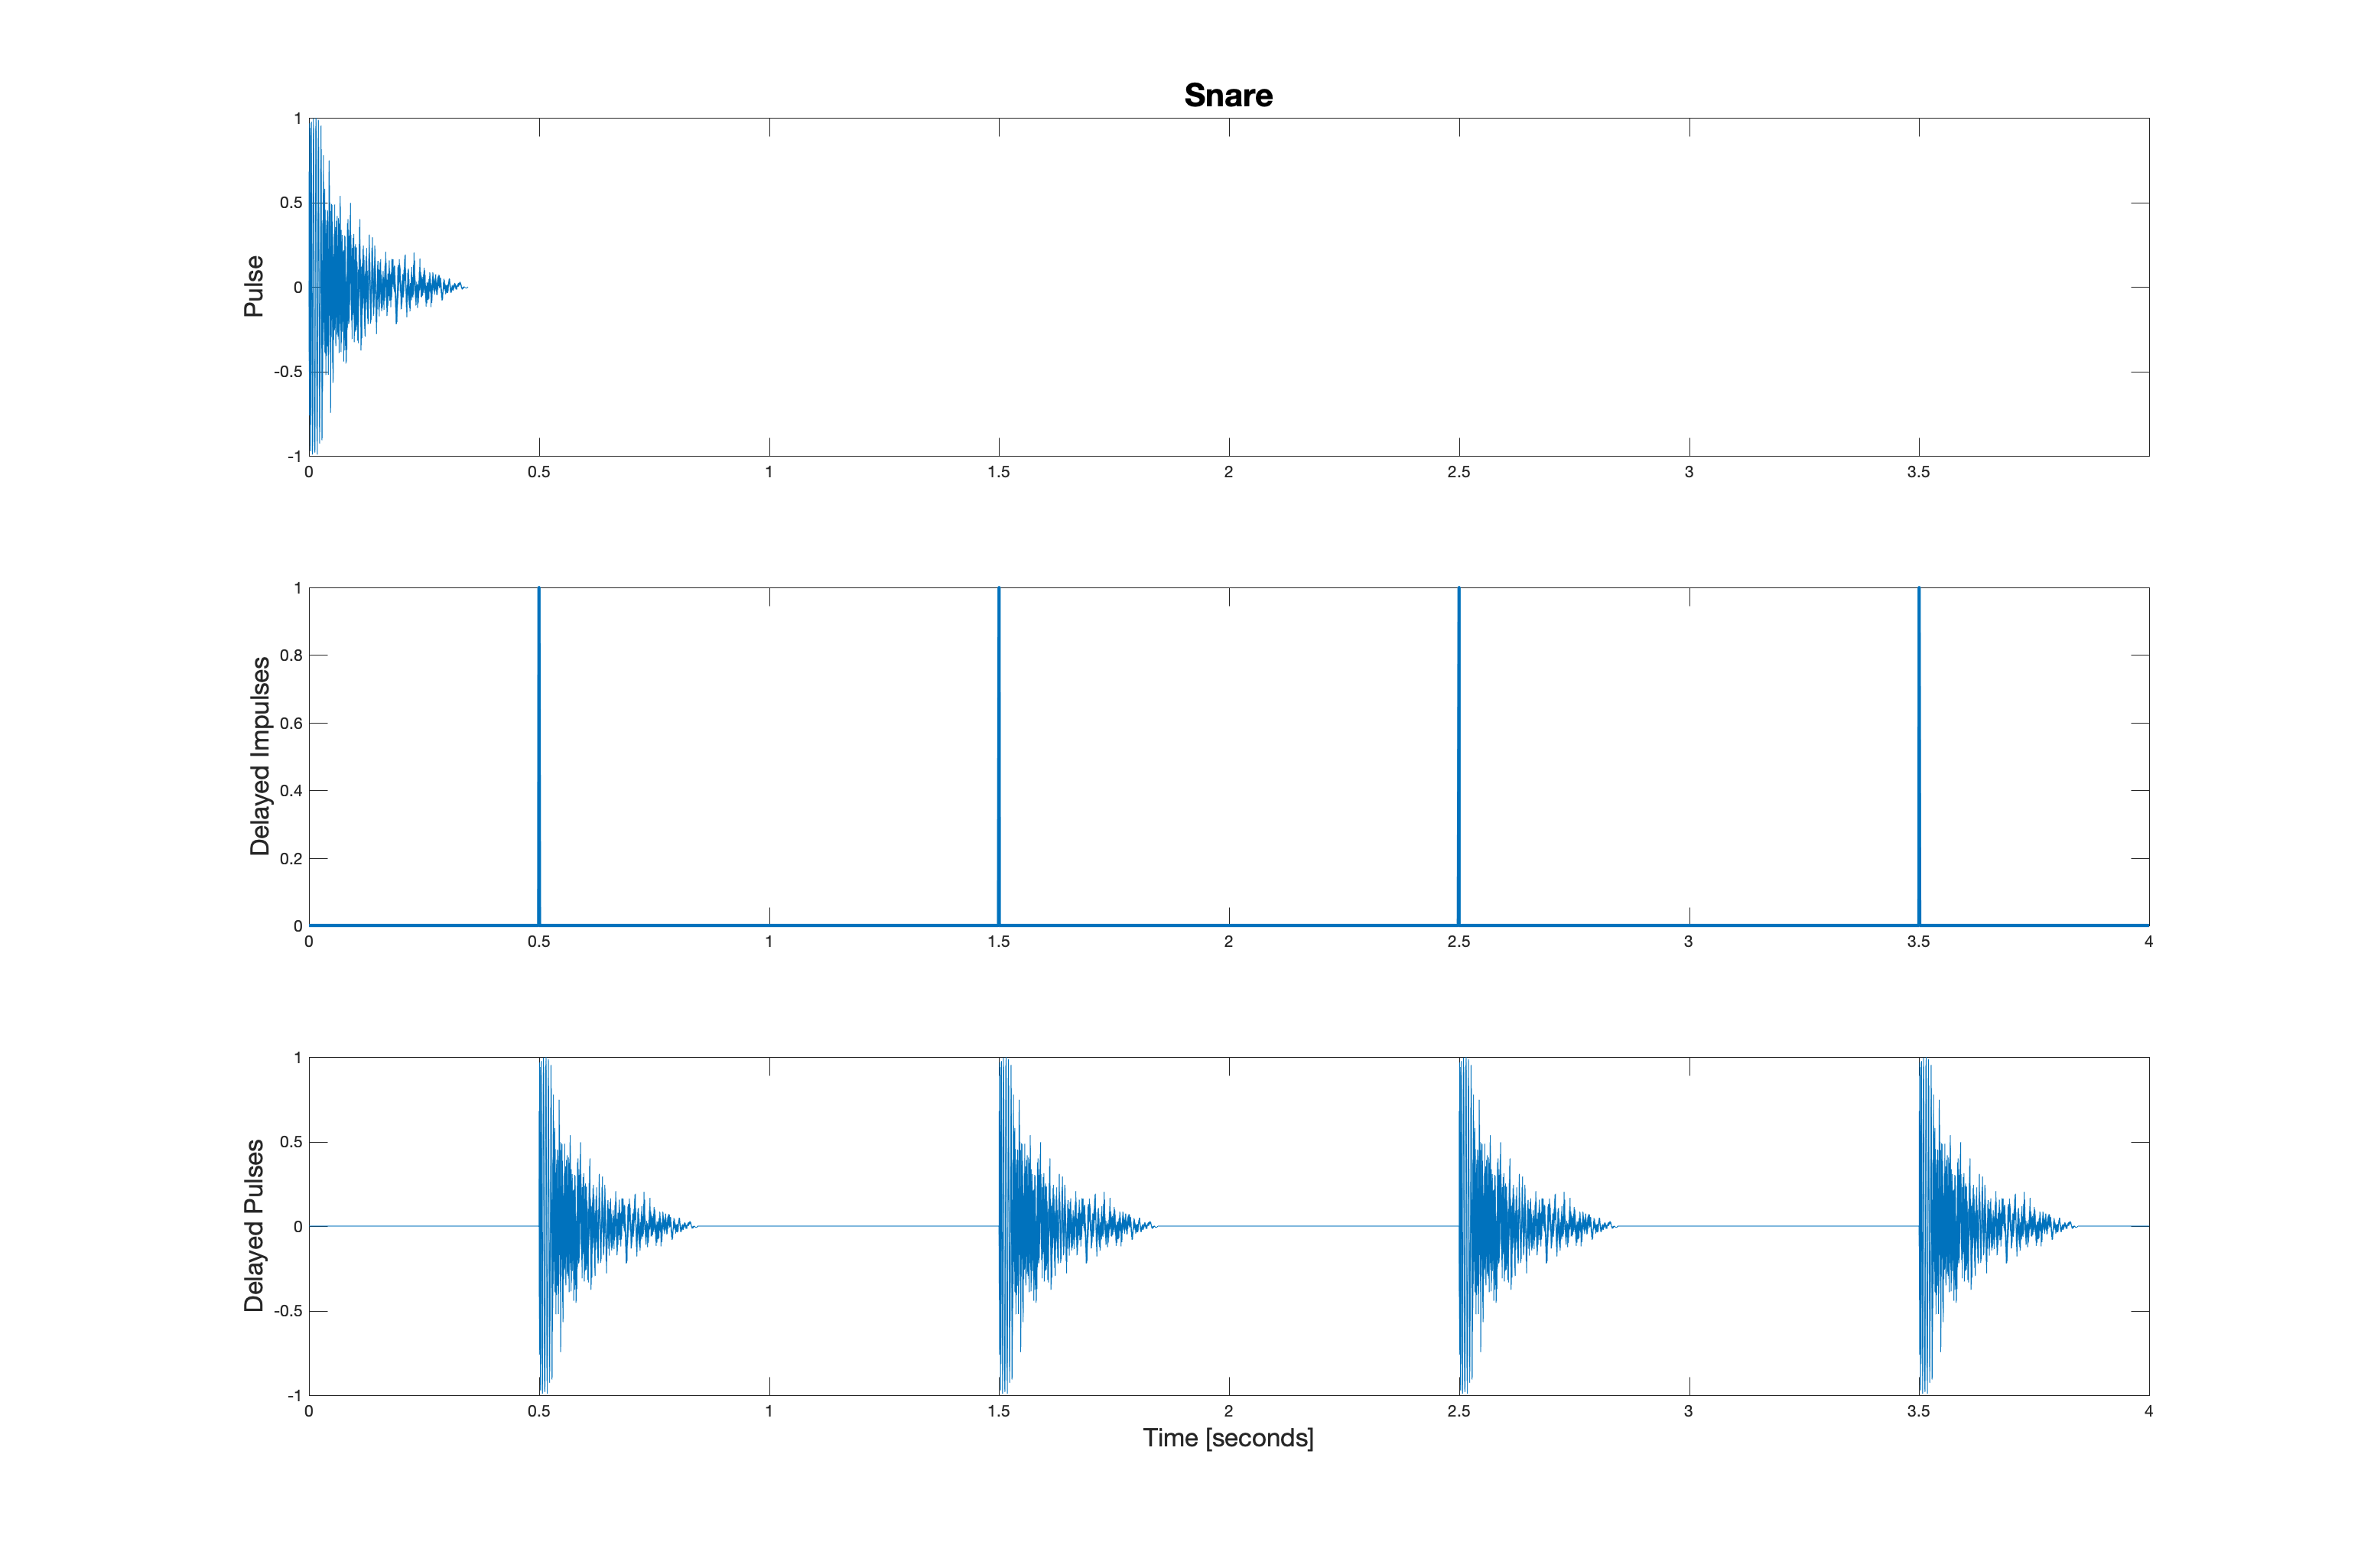
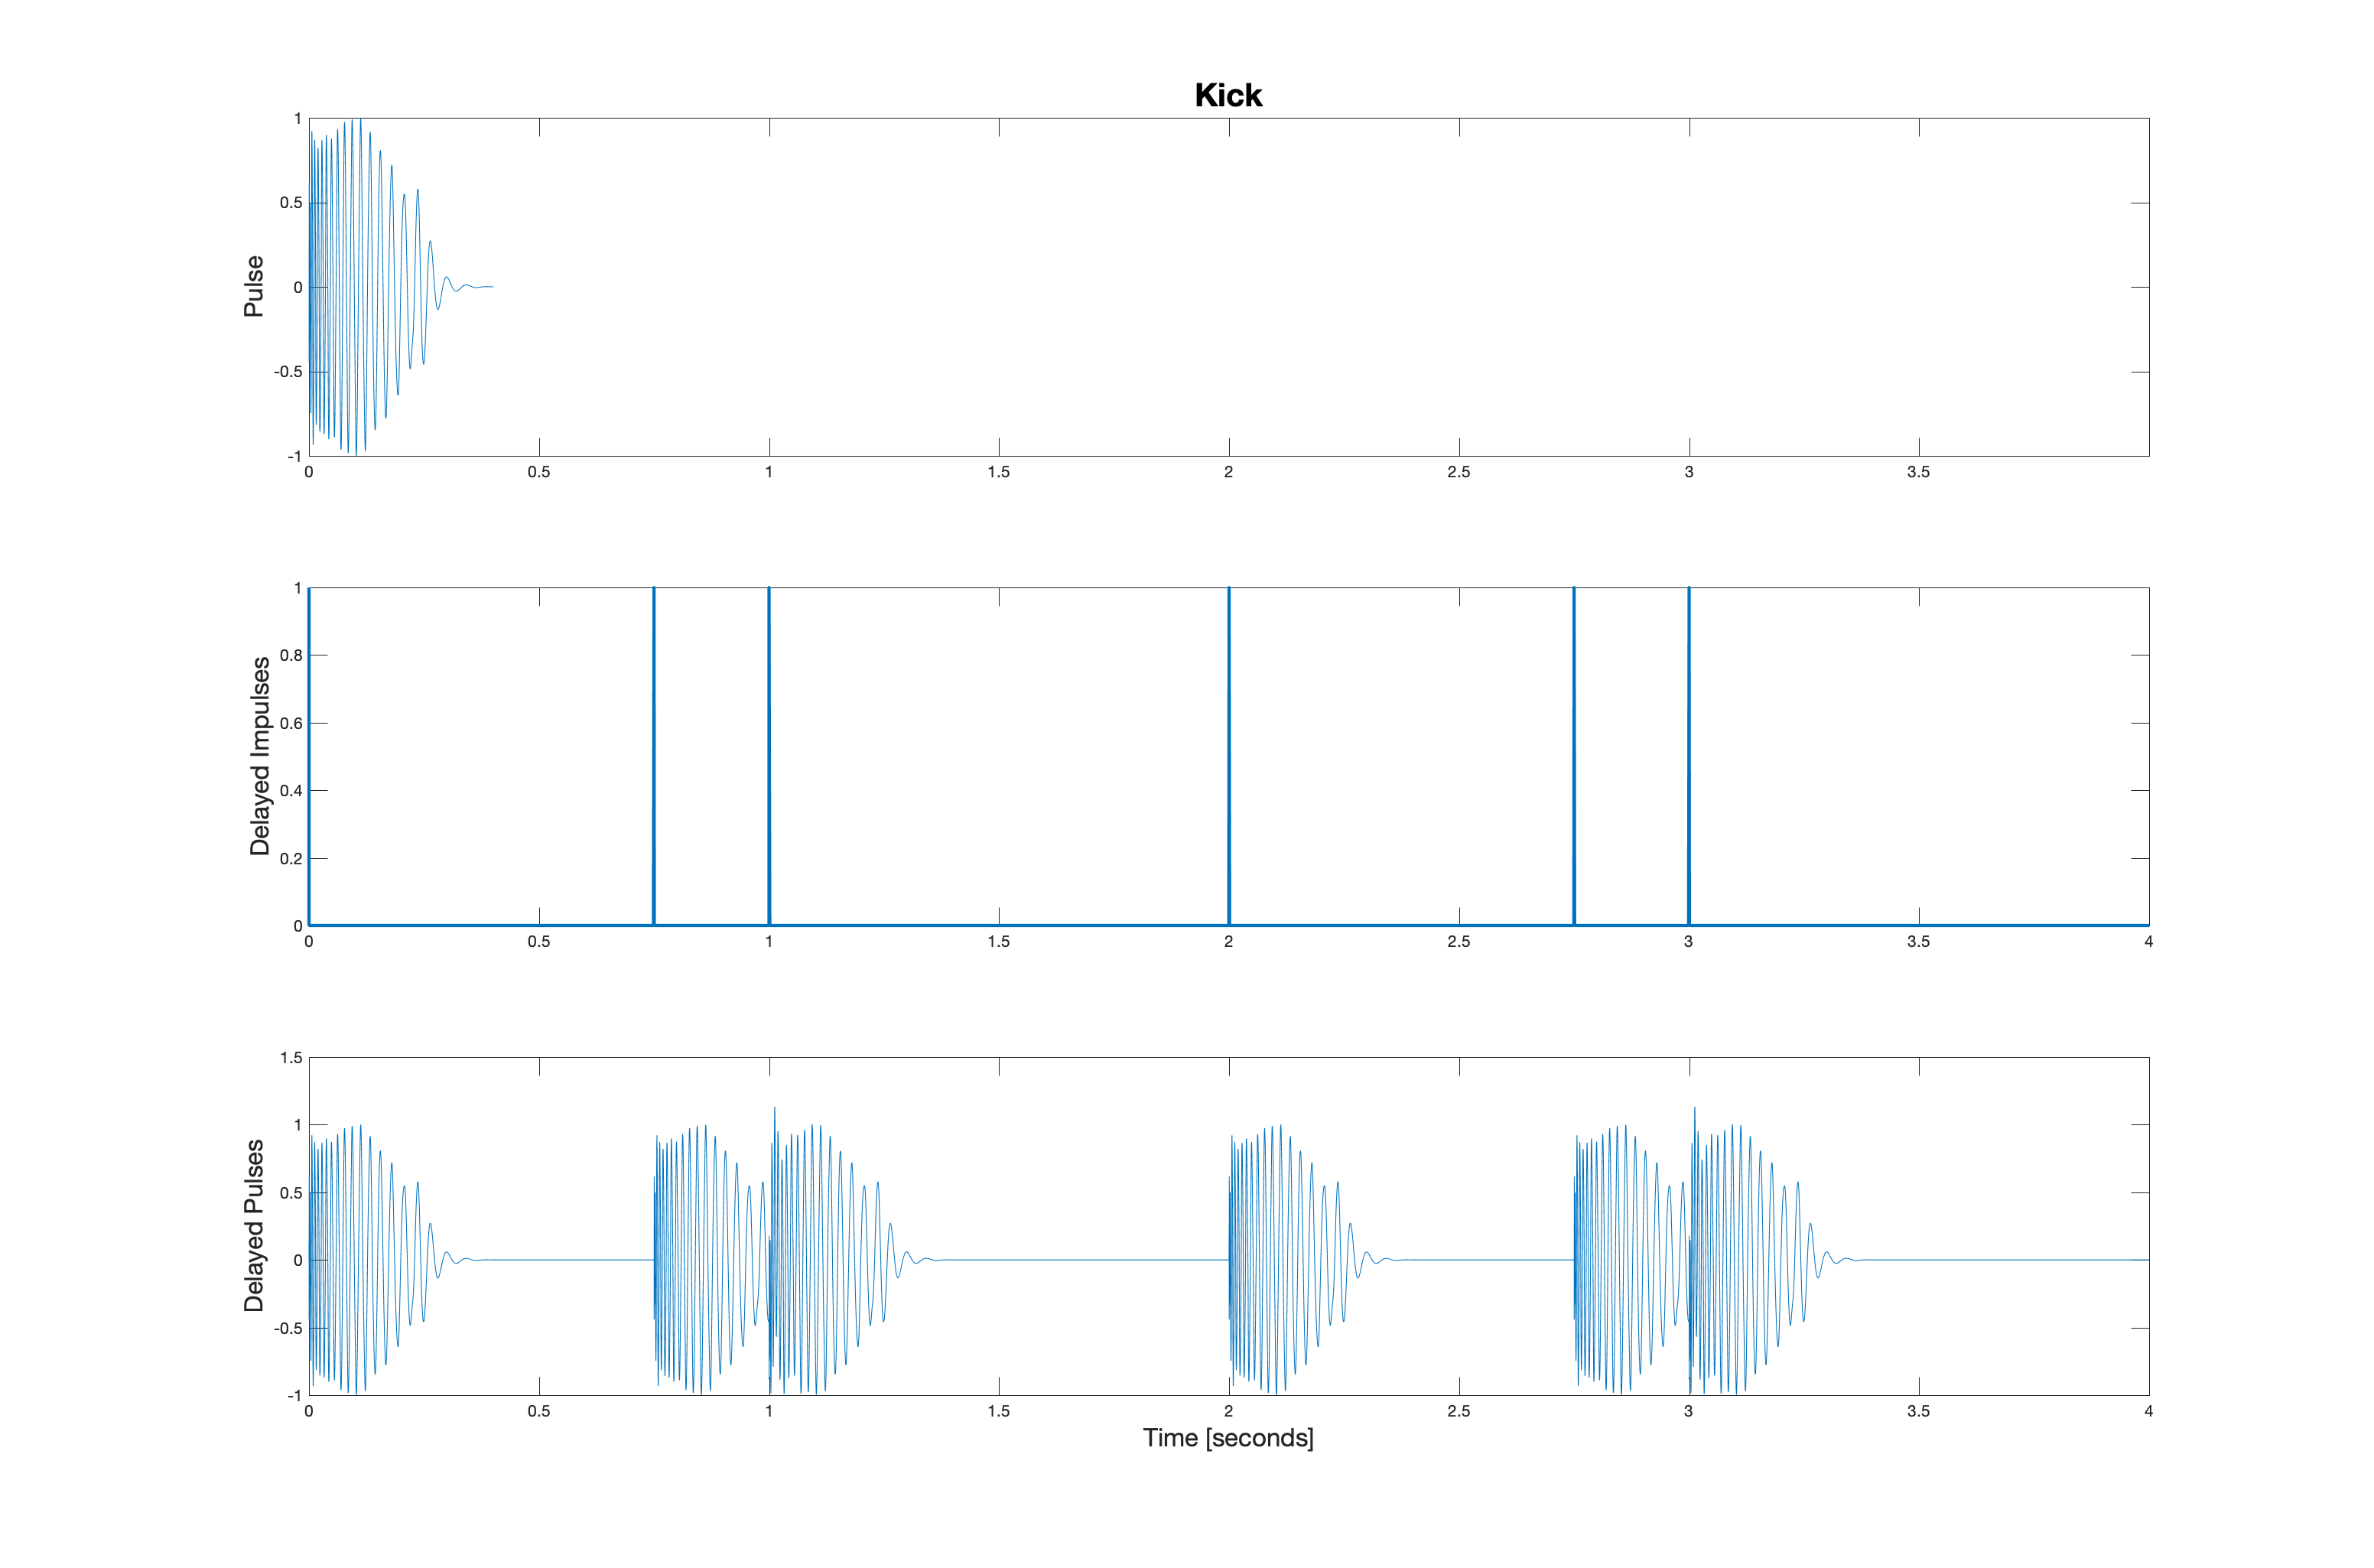
The other drum kit sounds are a little bit more interesting. They are shown below in order: hi hat, open hat, snare, and kick. Clicking on these images will play the pulse train sound.
This yields the five waveforms shown below. Be sure you see the connection between the location of the impulses and the replicas that result from convolution.
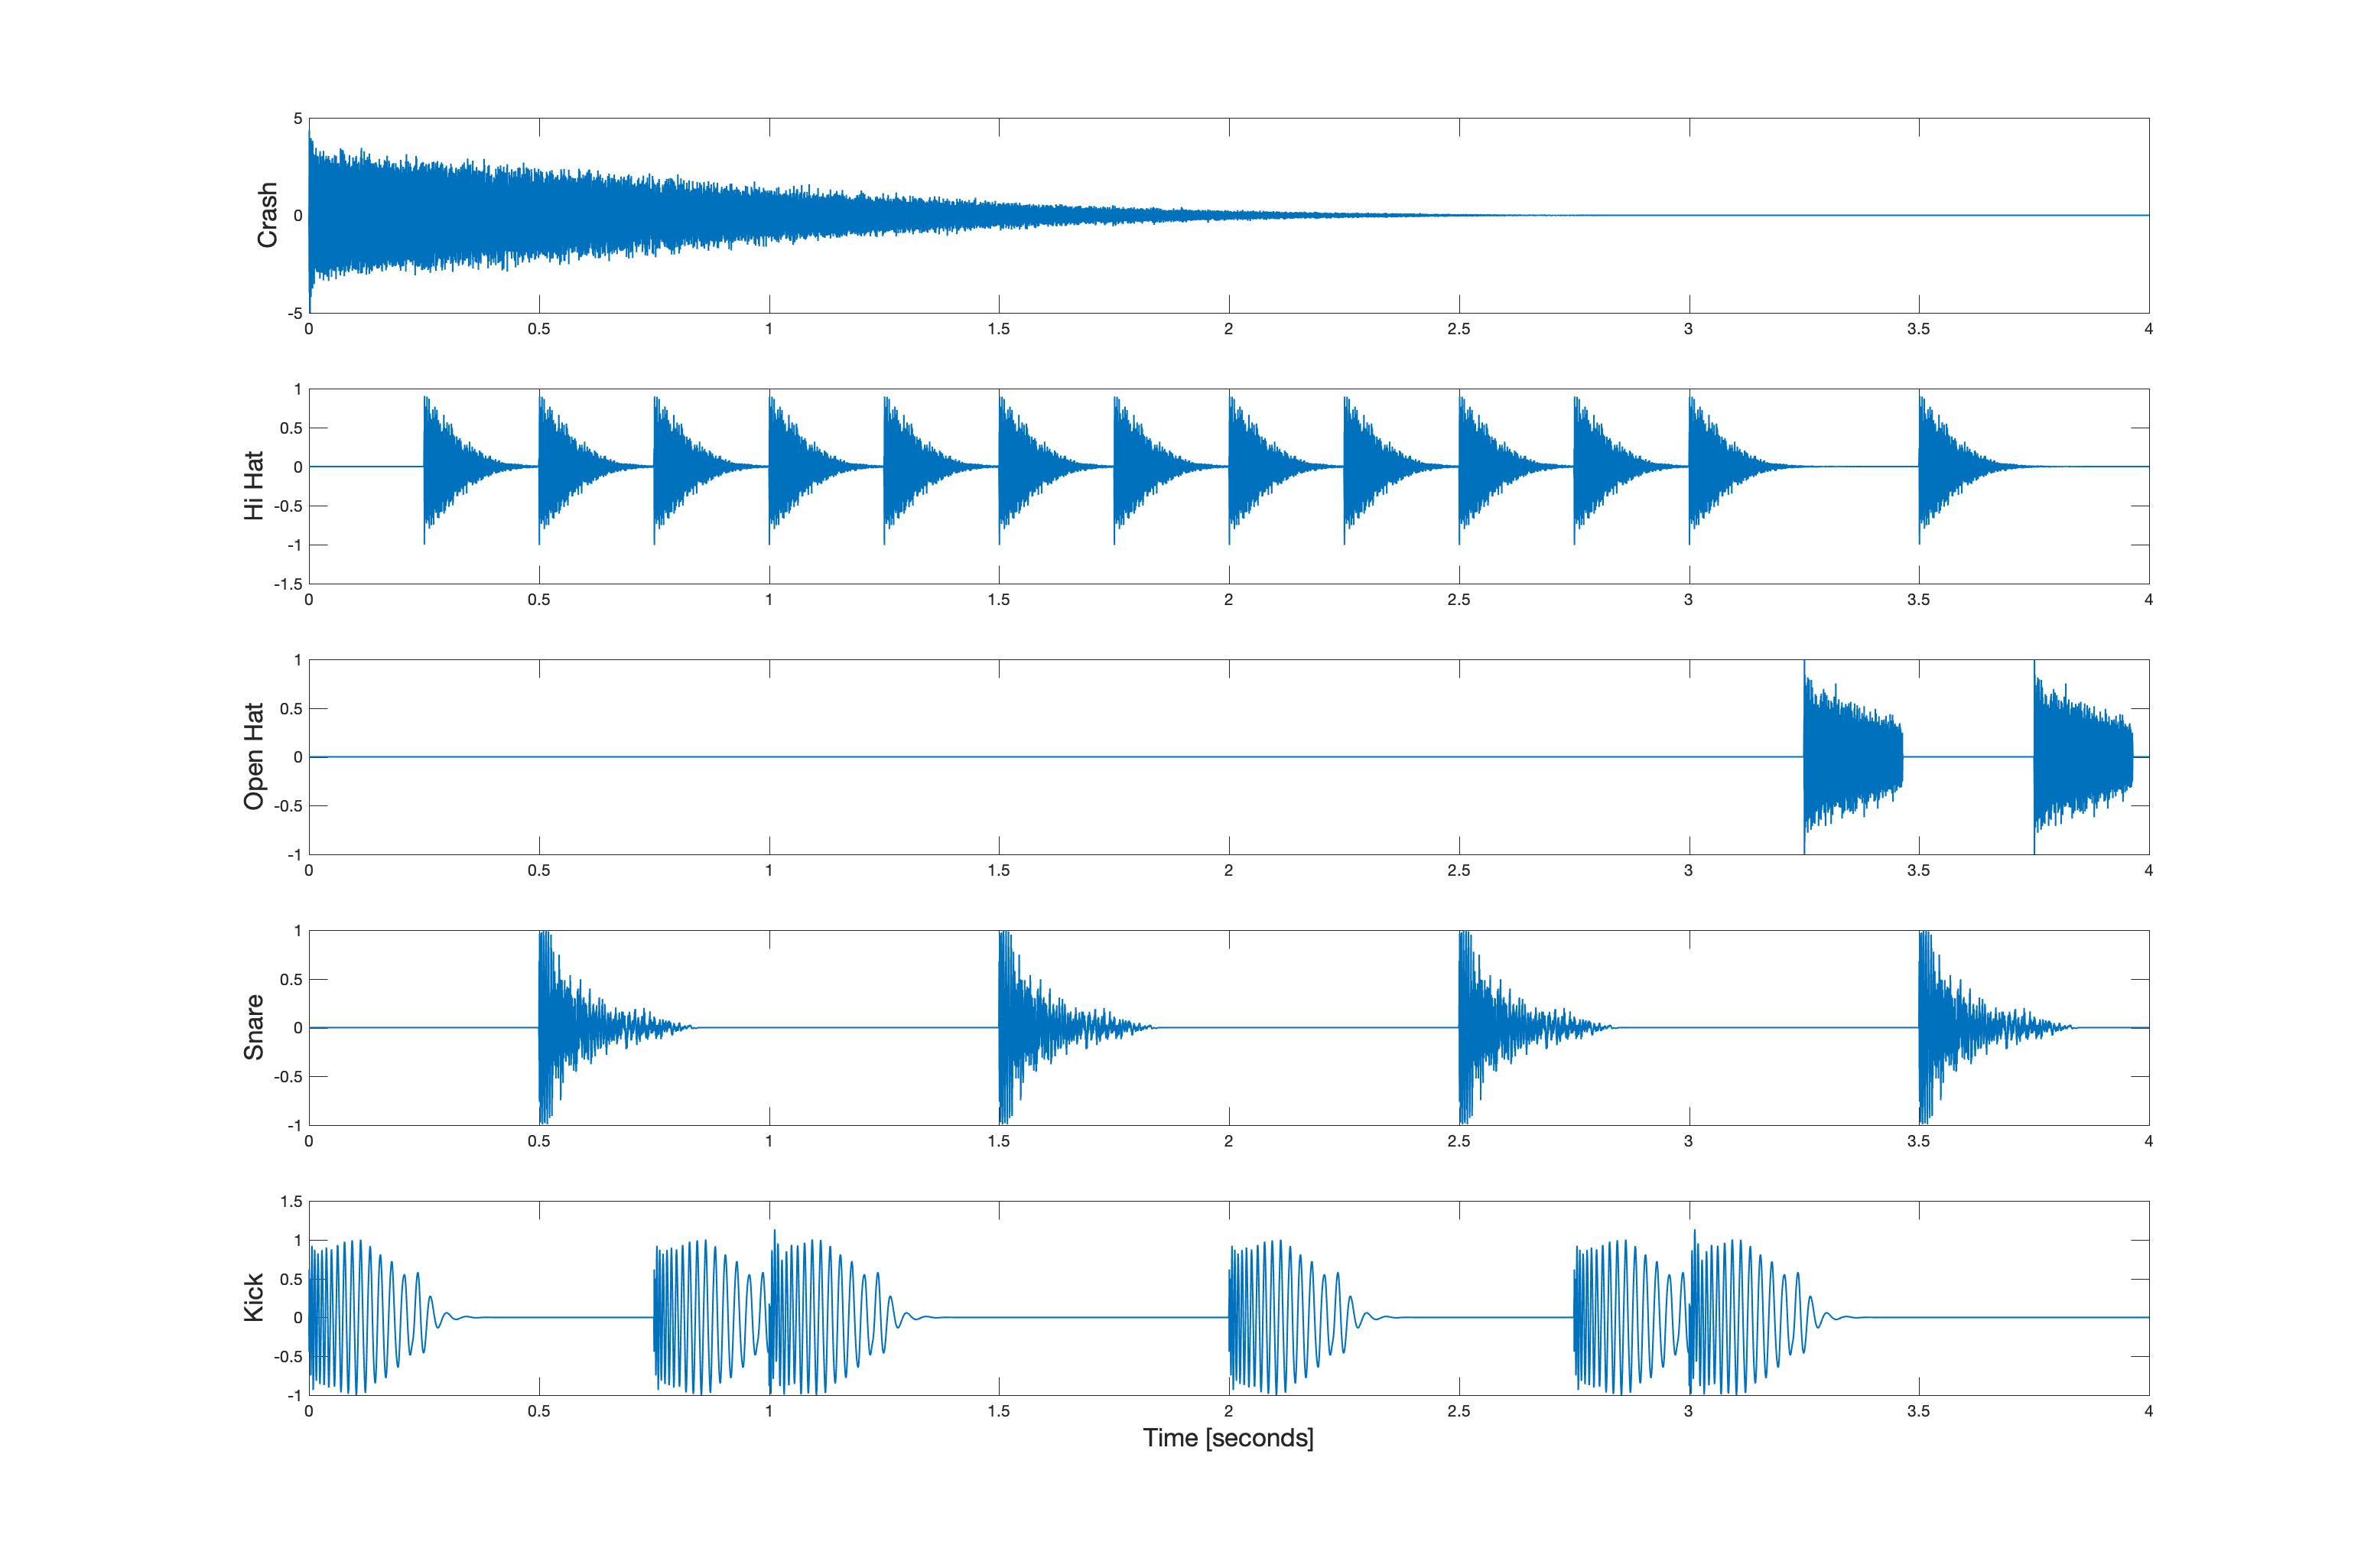
When these five signals are added together, we have the following waveform.

Click here to listen.
Sinc function in continuous time.
Question. For the sinc function
find the zeros and the amplitude when
Answer. Roughly speaking, a ratio of functions of
The
Solving for
Apparently there is the potential for an infinite number of zeros. However, one the candidate zeros results in a
where
Therefore, the
The sinc function
When
Here is a plot of the sinc function for
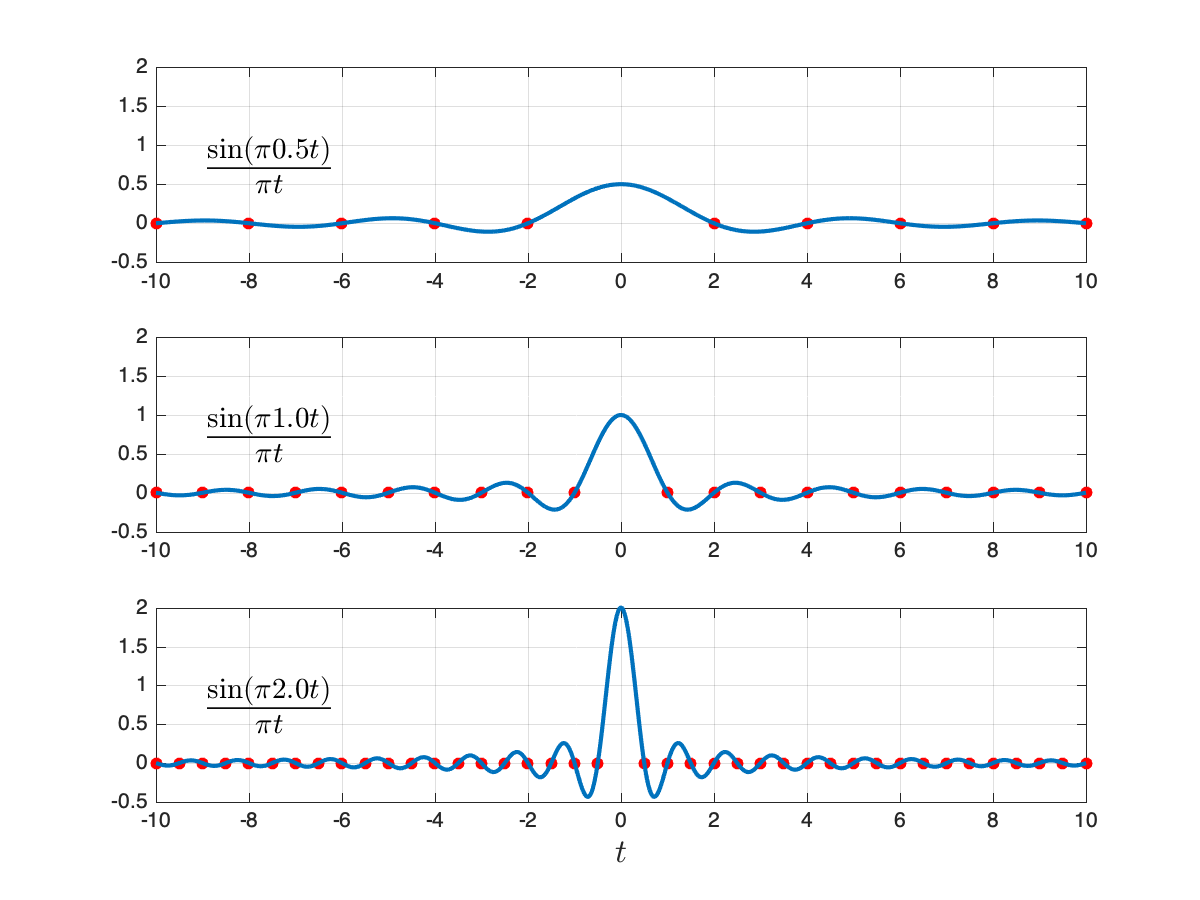
Here is another plot comparing sinc functions for 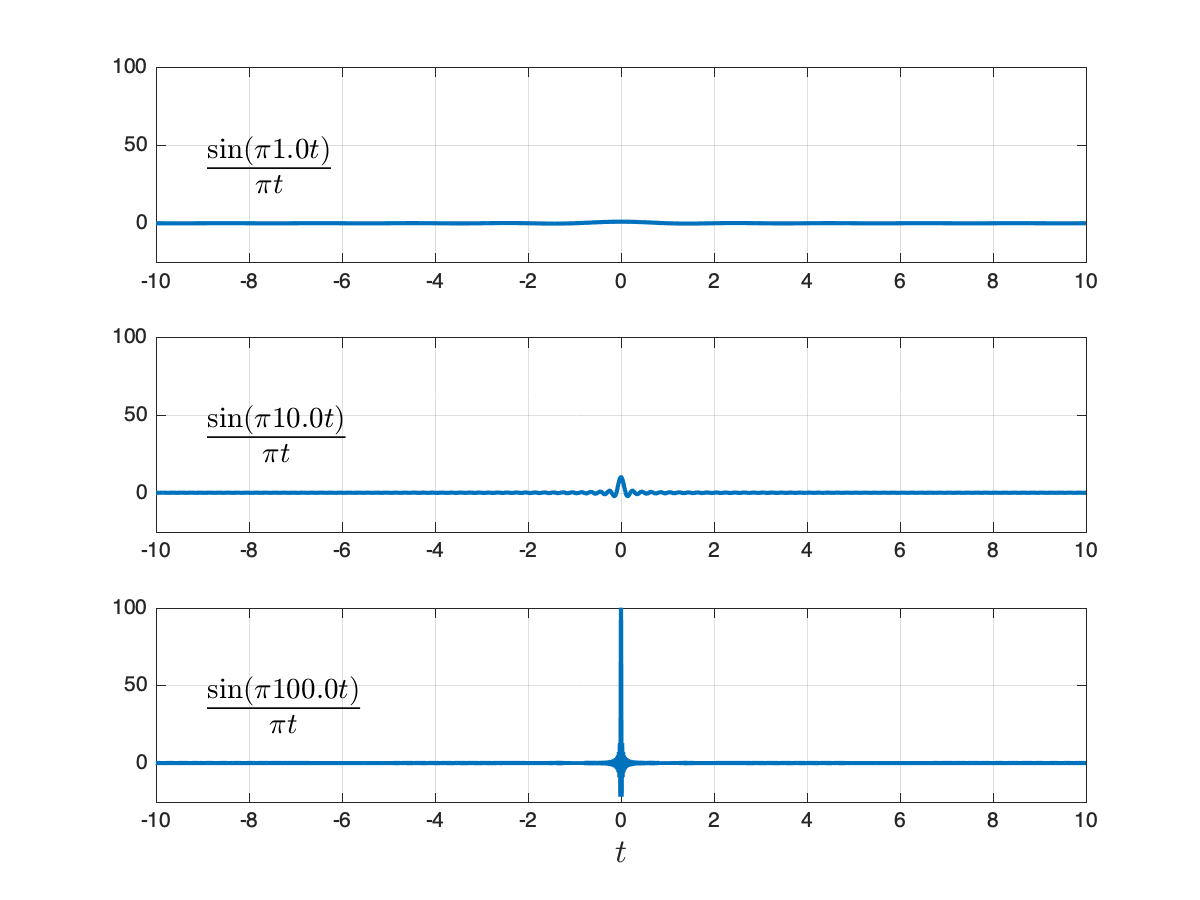
Sinc function in continuous time.
Question. For the sinc function
find the zeros and the amplitude when
Answer. The zero crossings occur at
Sinc function in discrete time.
Question. For the sinc function
find the zeros and the amplitude when
Answer. Using the reasoning from above, the amplitude when
Canceling
This equation must be satisfied for integers
The plot below illustrates these there cases for
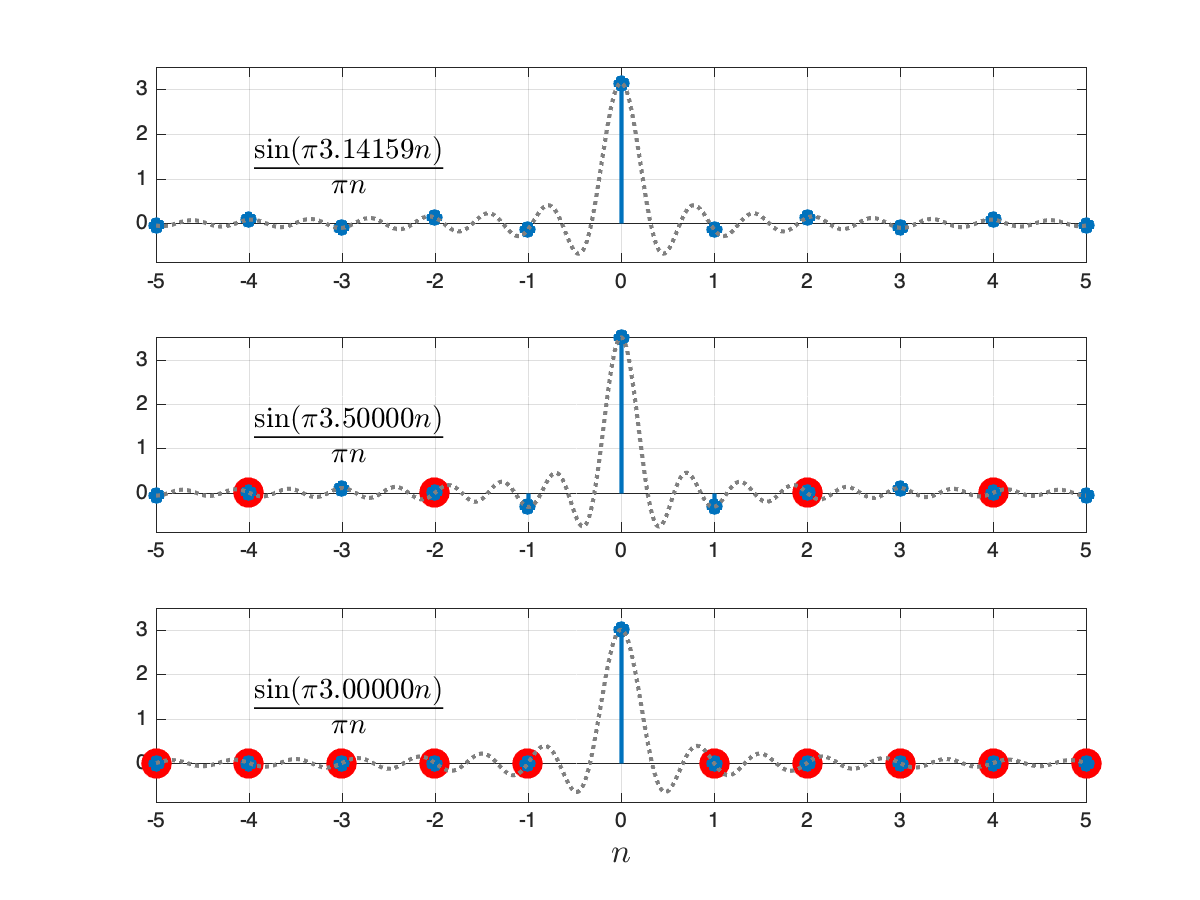
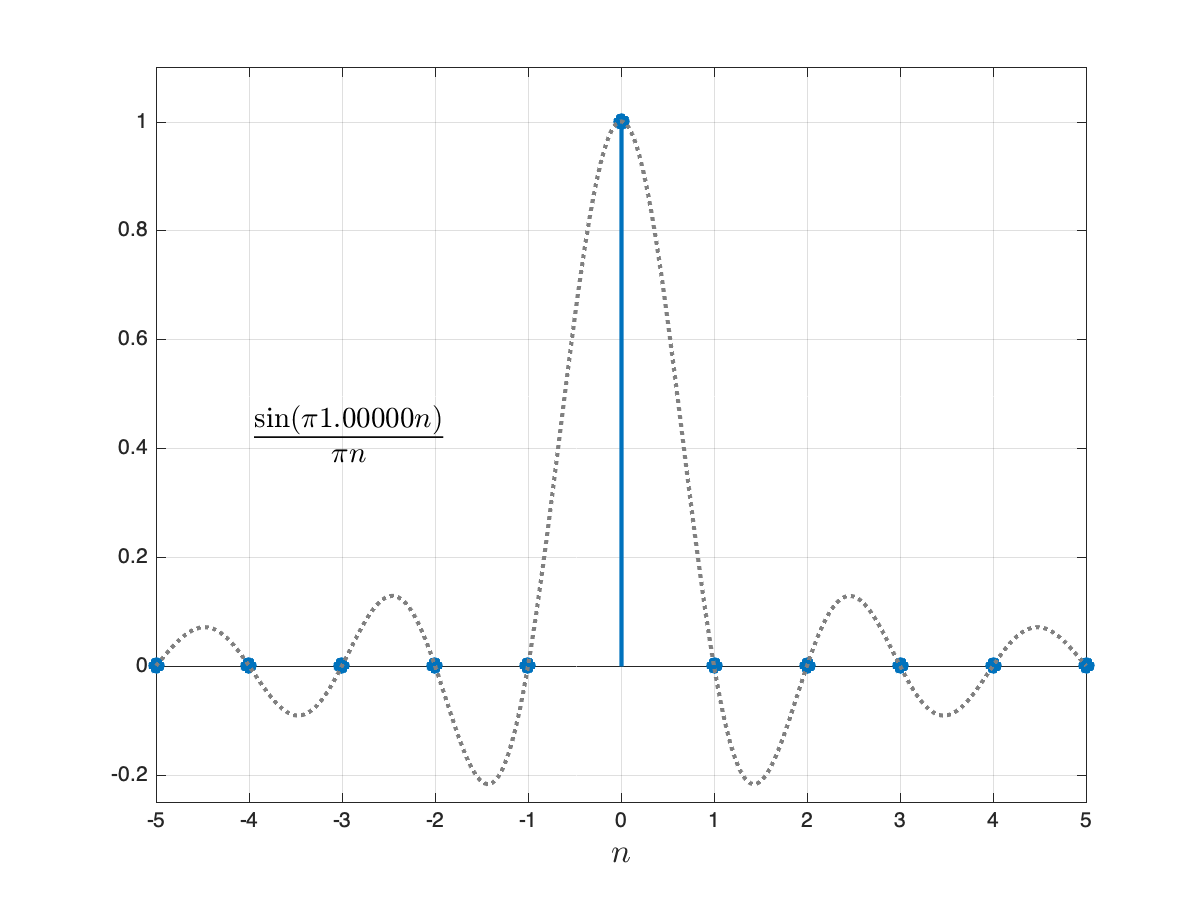
As a special case of the above for
This is illustrated in the figure below.
Periodic sinc function.
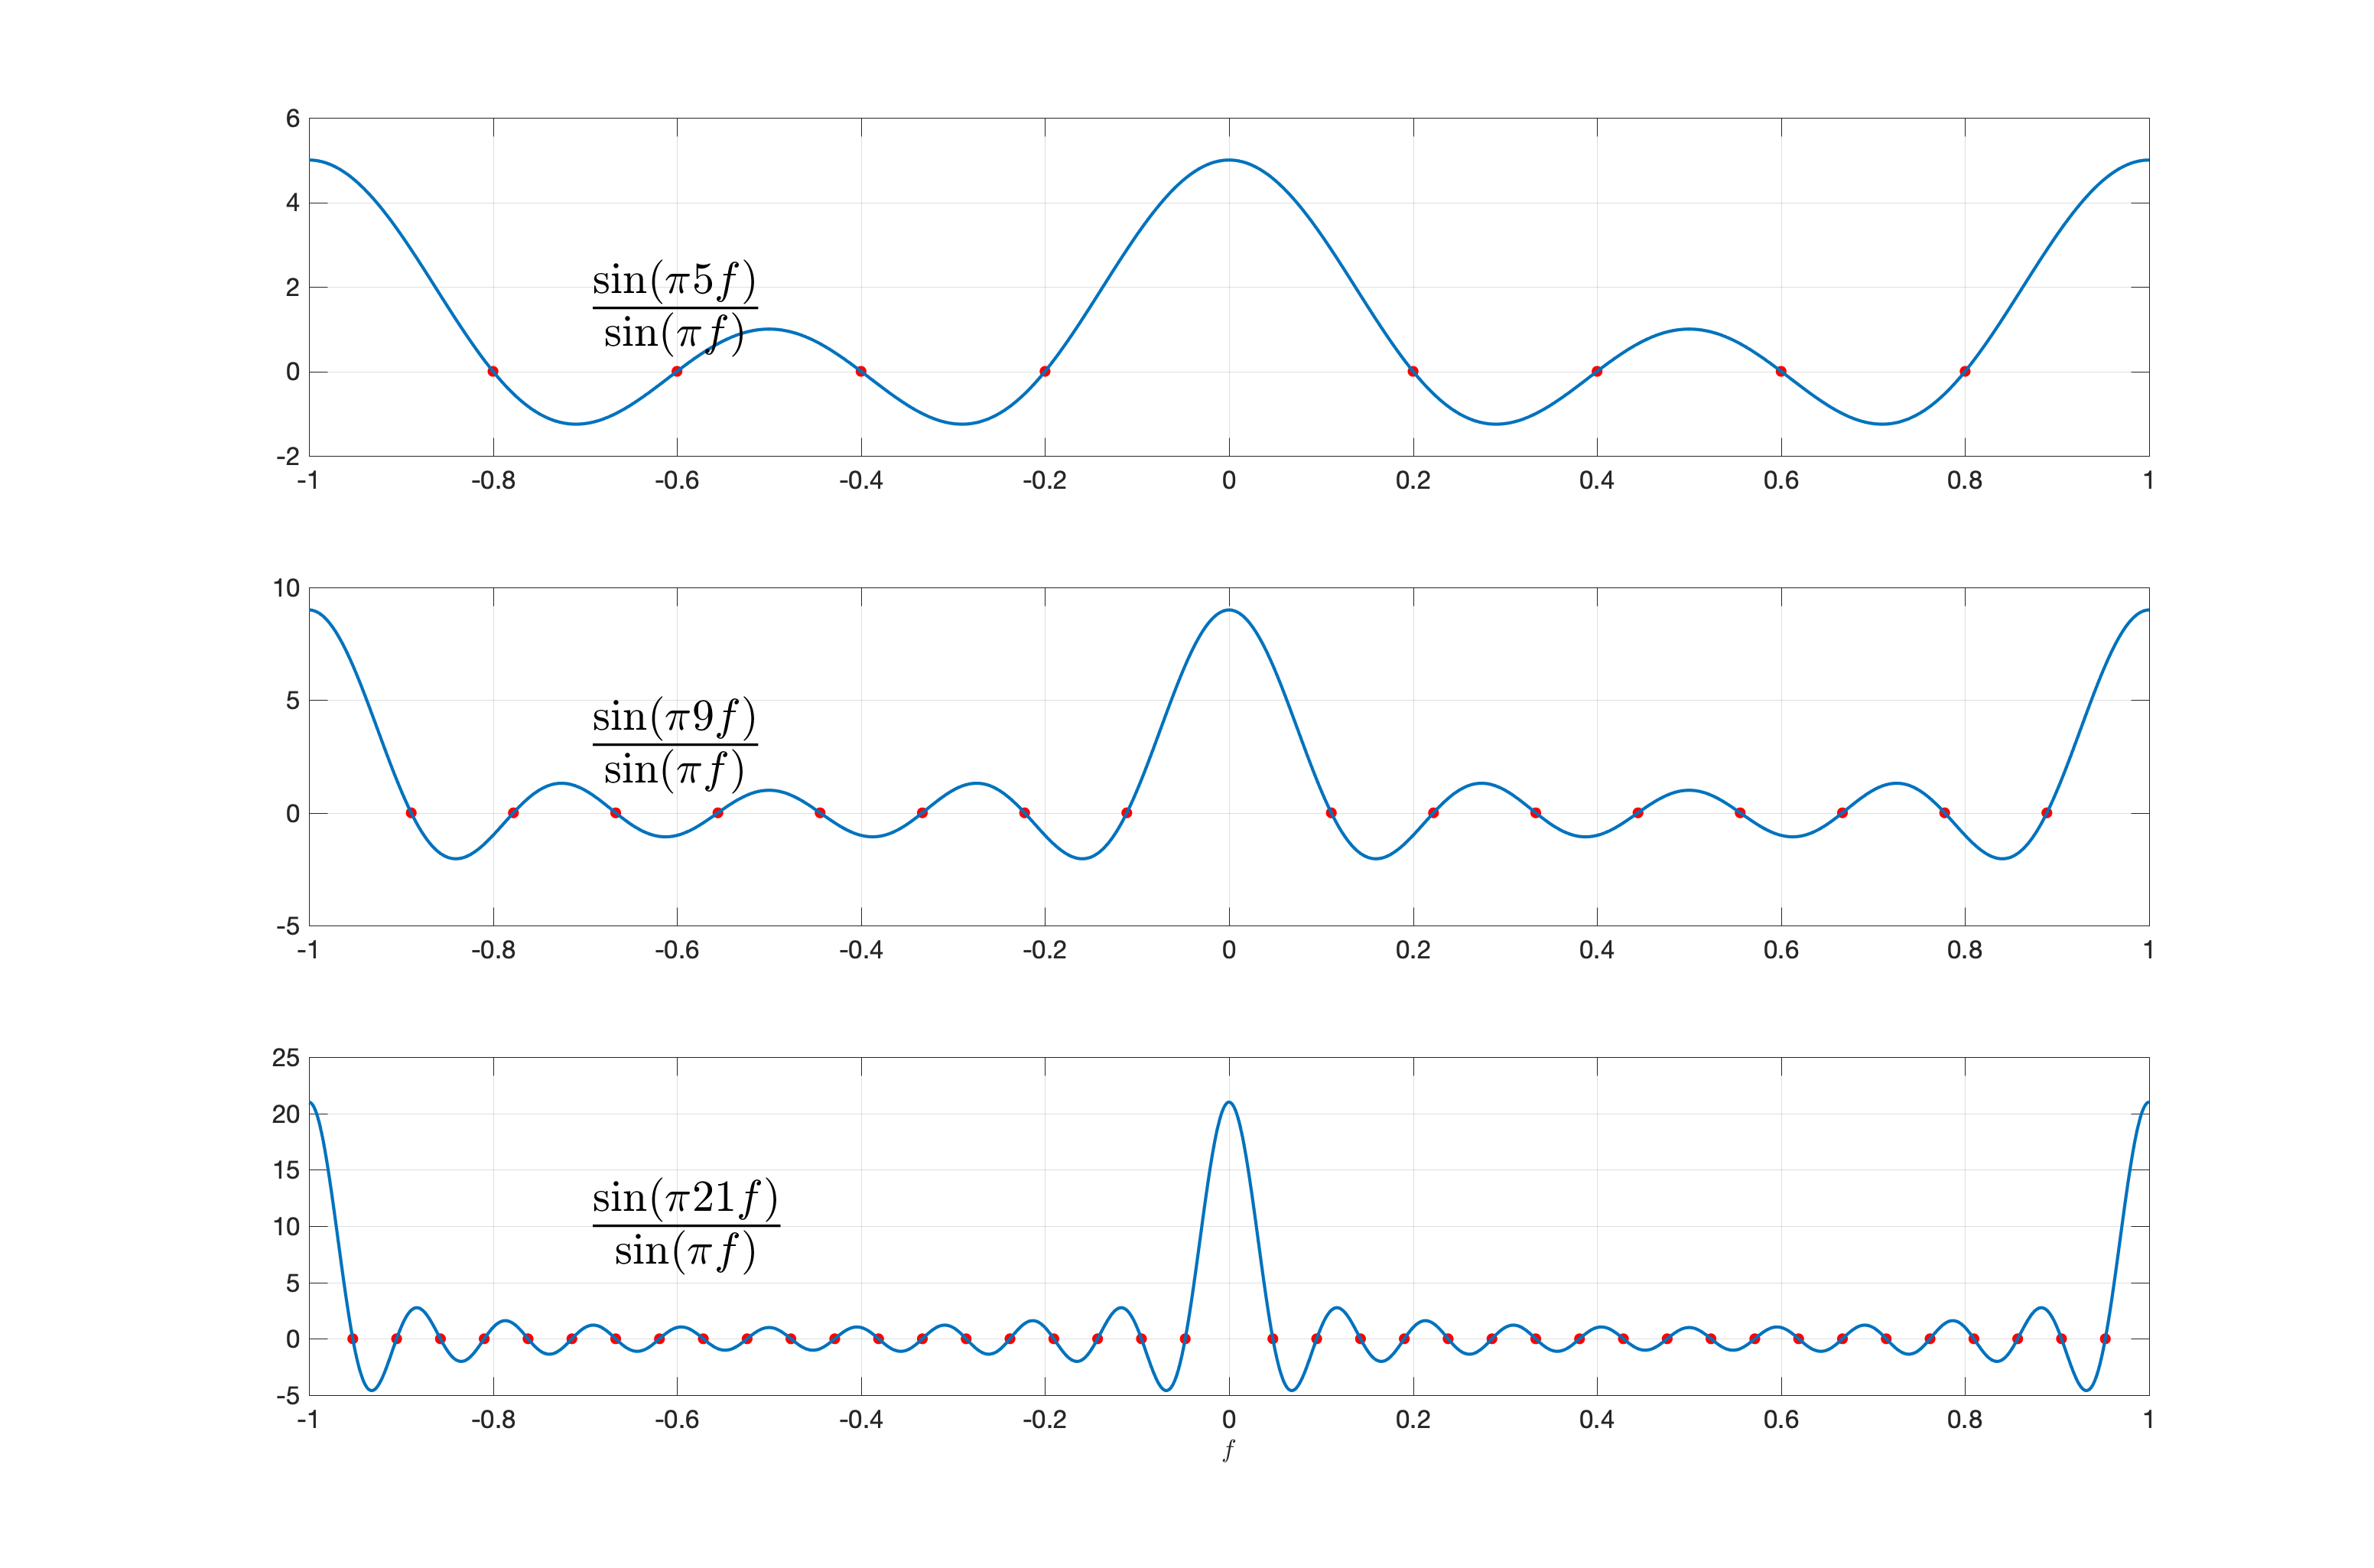
Question. For the periodic sinc function
find the zeros and the amplitude at points where
Answer. First observe that
The numerator function
The demoninator function
The
The set of candidate zeros for
Complex exponential signals.
The figure below shows eight different complex exponential signals of the form
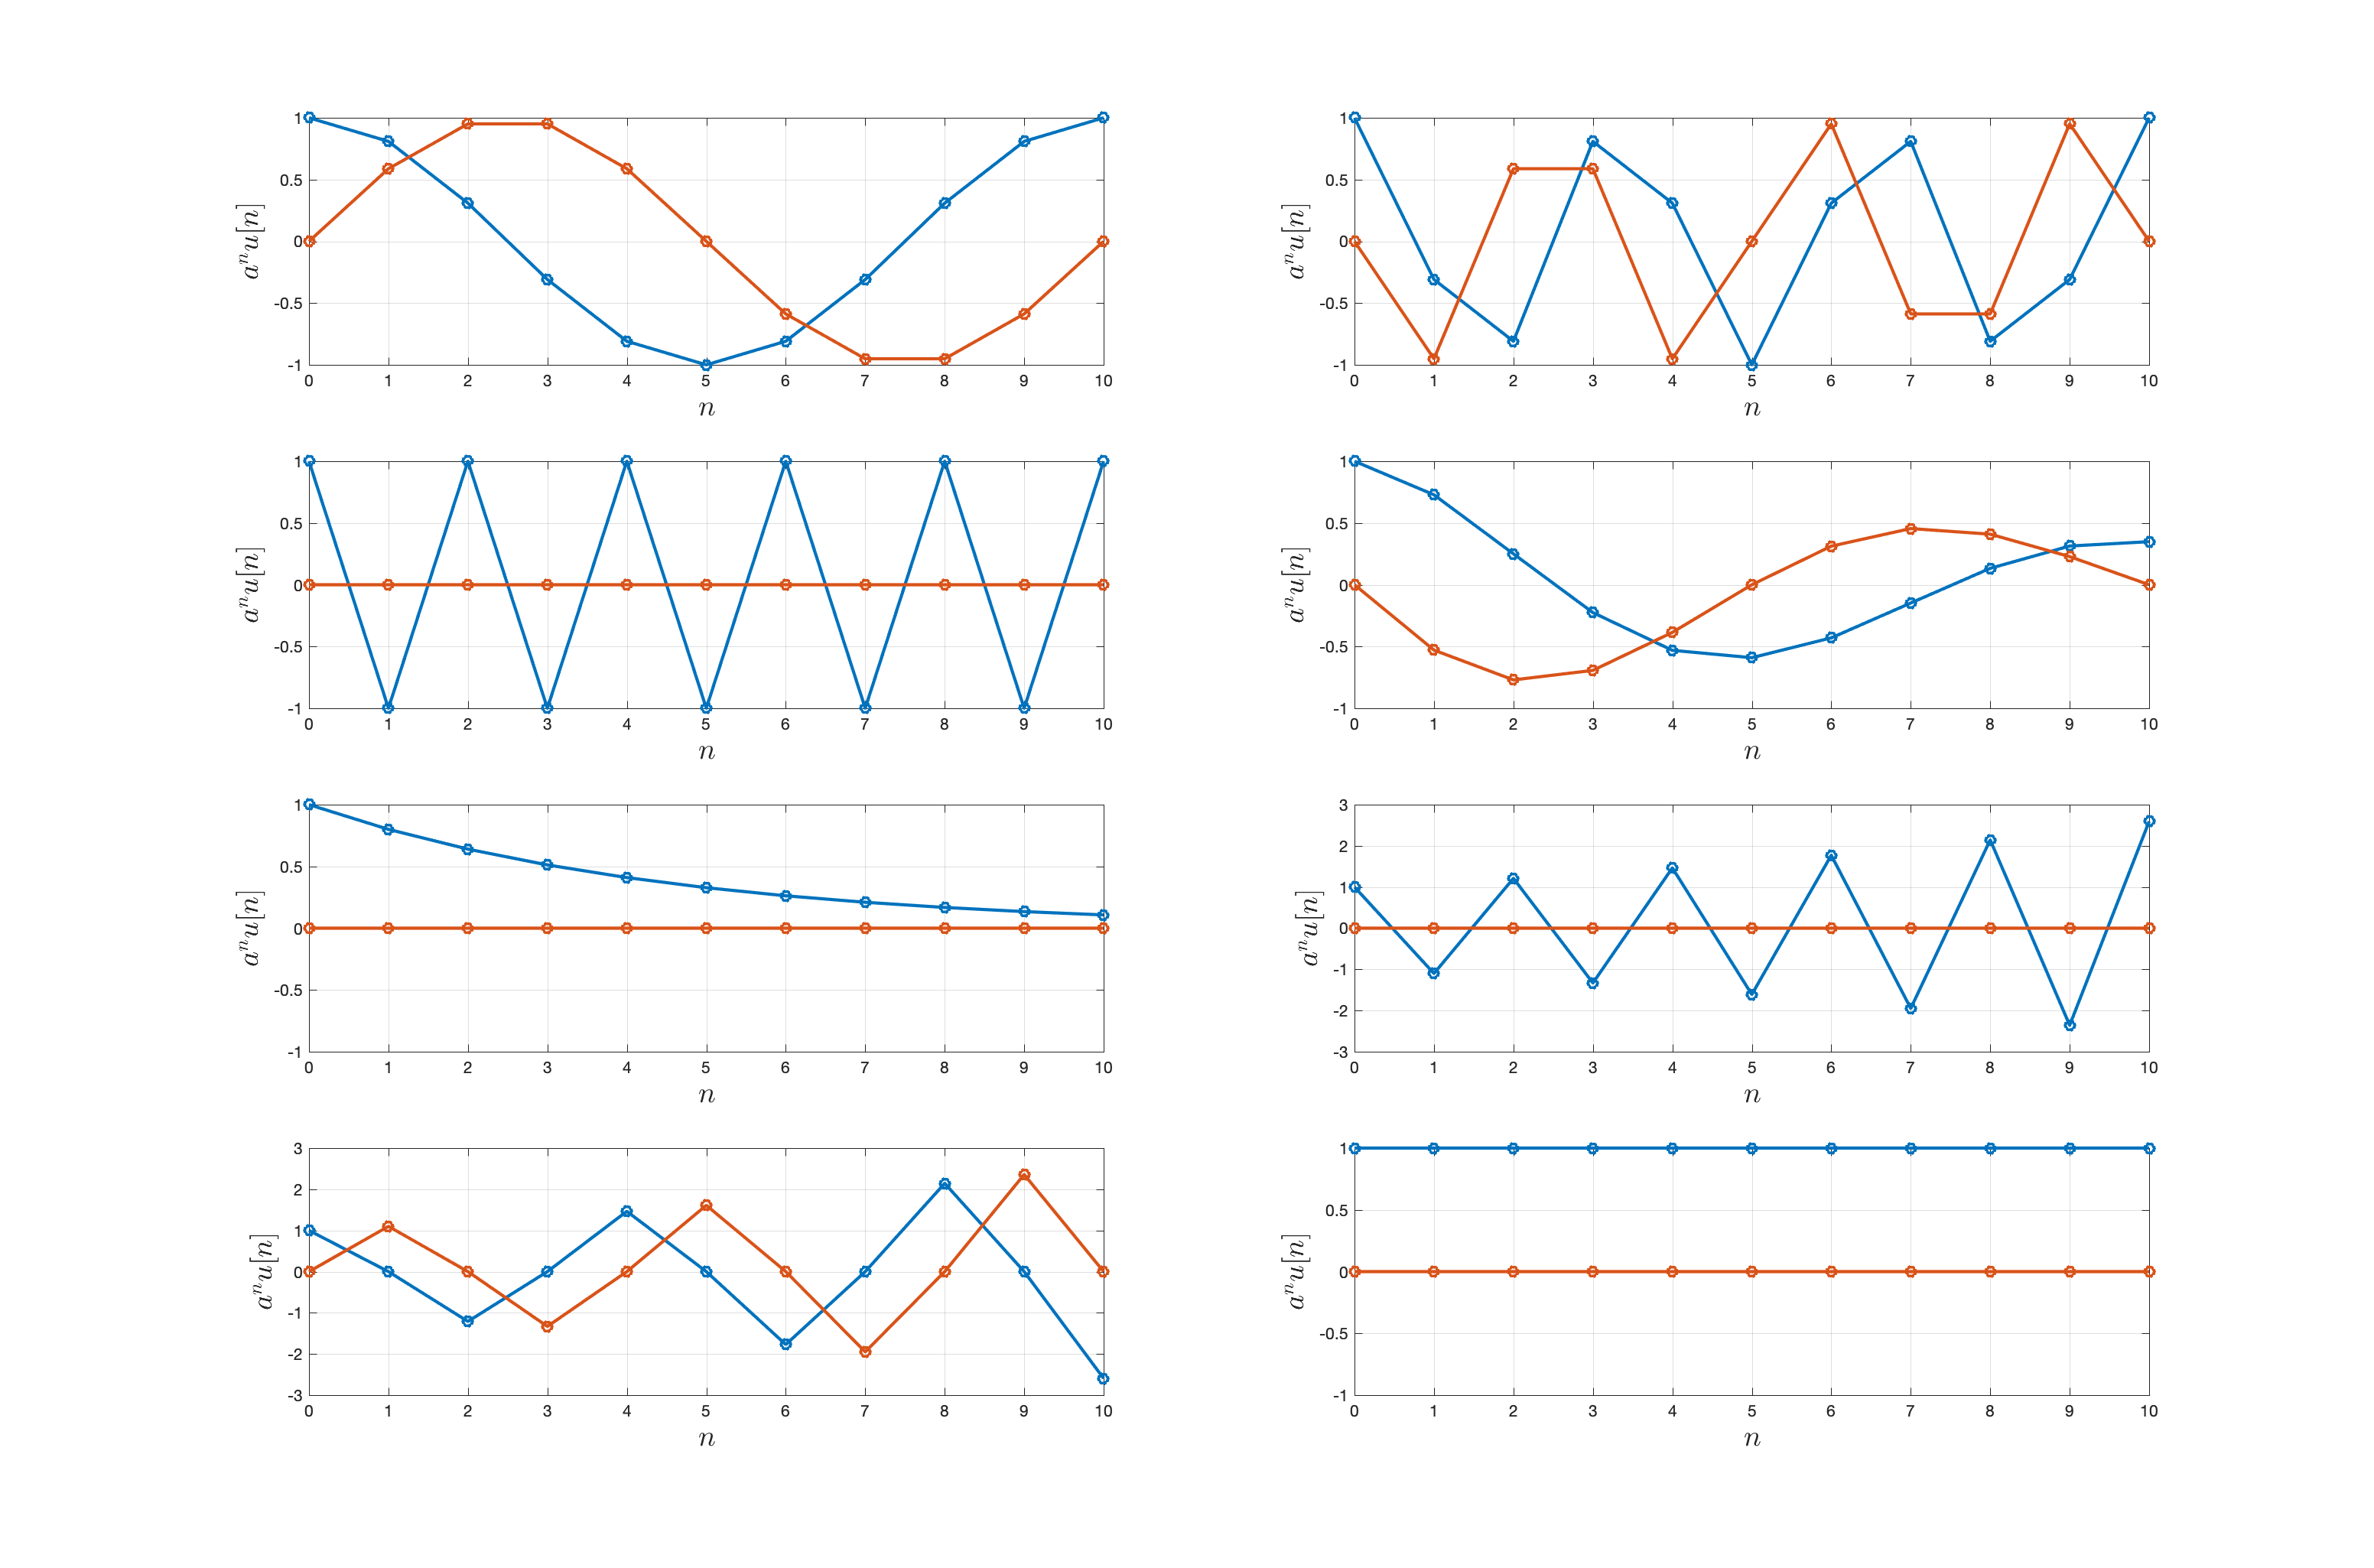
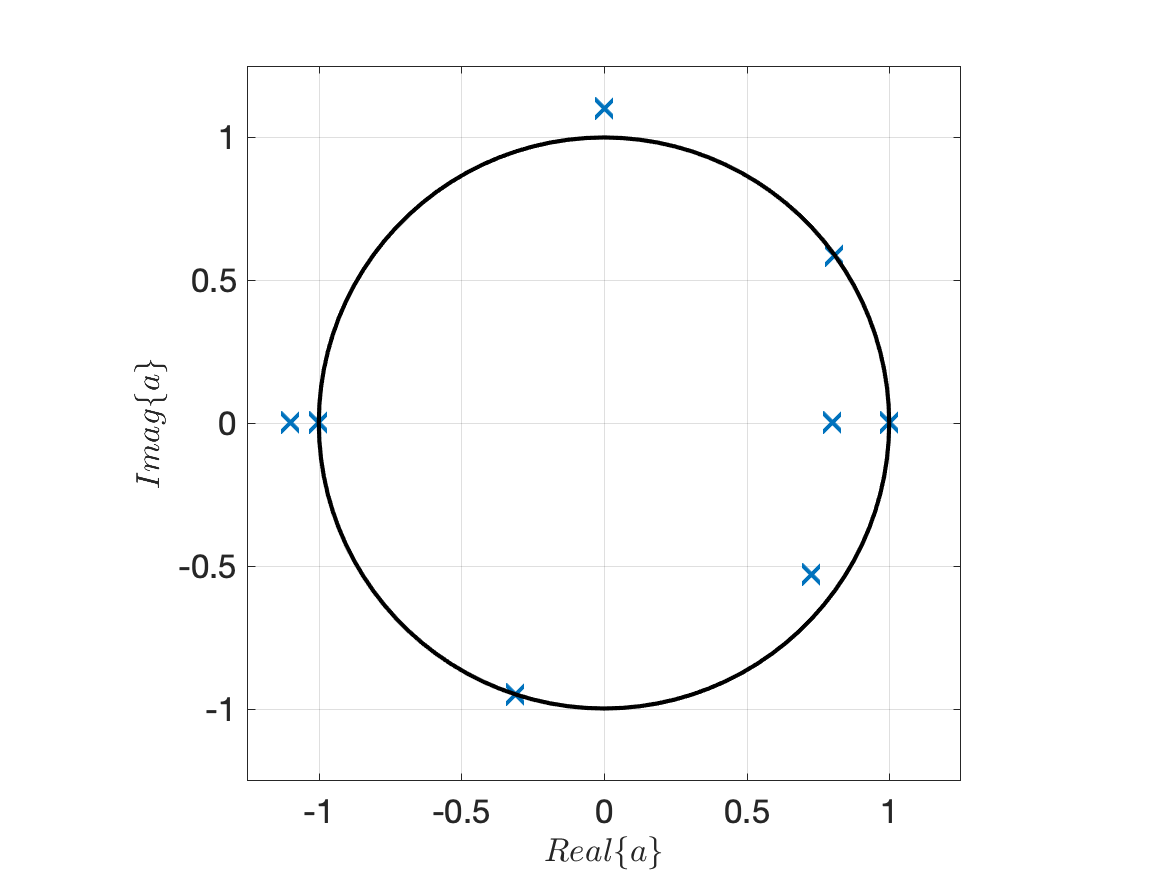
Complex exponential signals.
Consider the complex exponential signal
What is its frequency?
What are the units of frequency in discrete-time?
What is the alias of this frequency in the interval
What is the alias of this frequency in the interval
Sketch a picture of the following types of signals.
Causal
Anti-causal
Non-causal
Non-anti-causal
Causal left-sided
Non-causal left-sided
Anti-causal right-sided
Non-anti-causal right-sided
Causal finite
Non-causal finite
Doubly infinite (two-sided)
Sifting property of Kronecker delta.
Question.
Answer.
Convolution property of Kronecker delta.
Question.
Answer.
