| Utah State University |
|---|
| Department of Electrical and Computer Engineering |
| ECE 3640 - Discrete-time Signals & Systems |
Sounds of the Hagia Sophia
To appreciate what this assignment is all about, take 4 minutes to watch this video.
This article provides additional information.
Synthesizing an Enclosure
This lab measures the impulse response of an enclosure and then simulates the measurement of real signals within the enclosure by filtering through the impulse response model.
Assignment
Measure enclosure impulse response
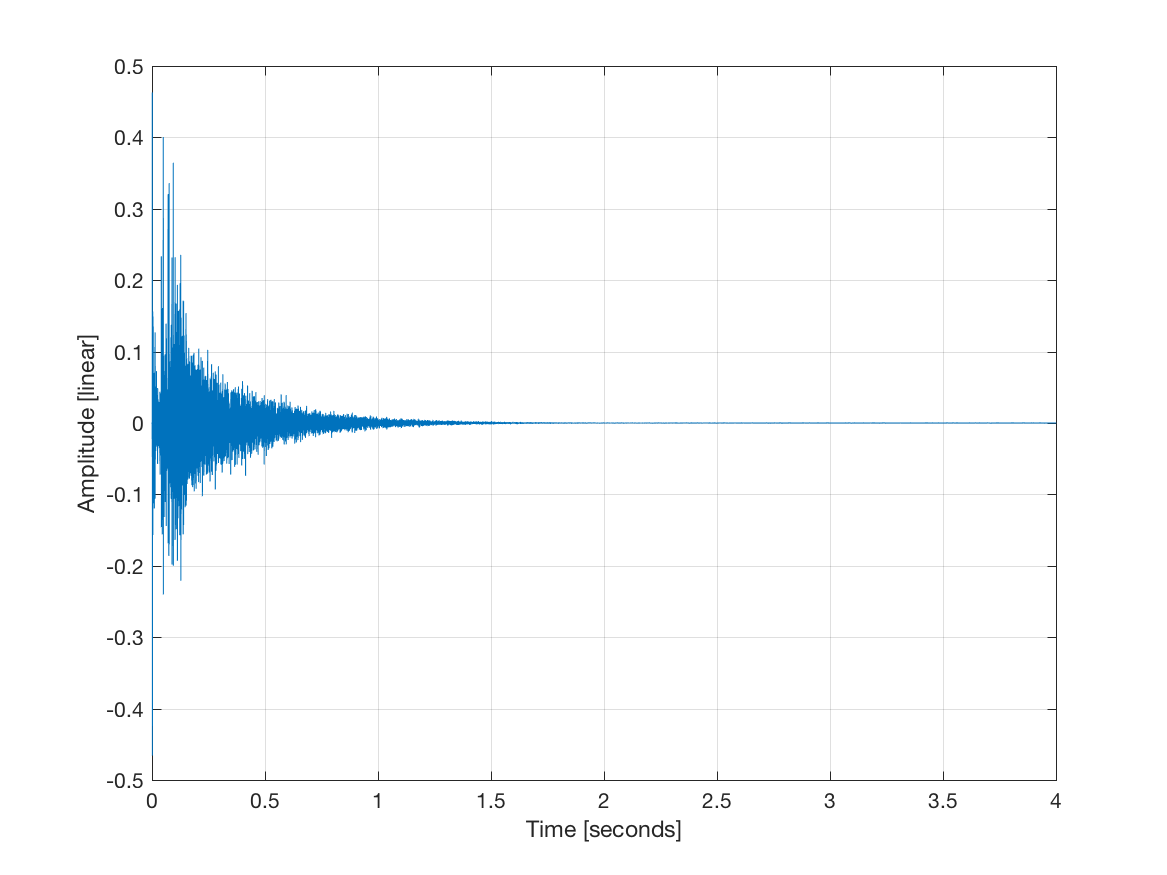 | 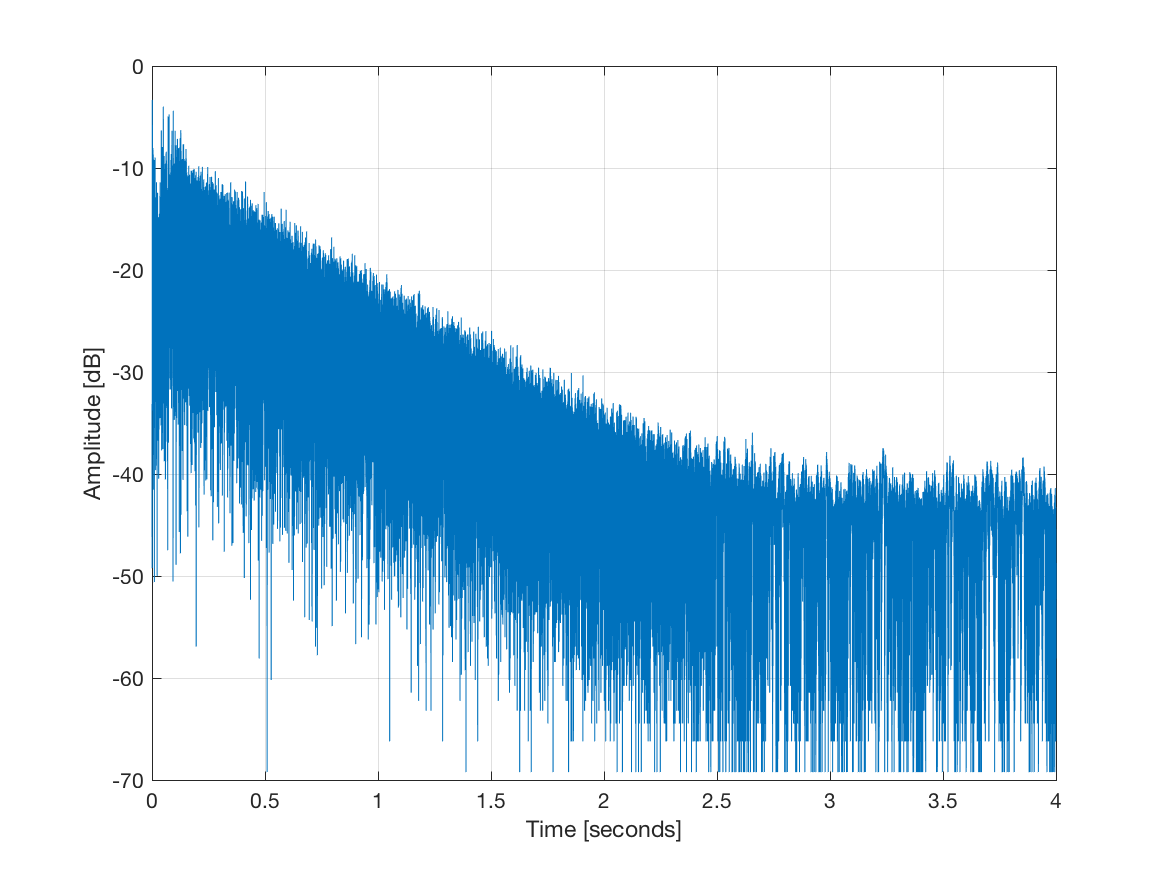 |
|---|---|
| Impulse response - linear amplitude | Impulse response - log amplitude |
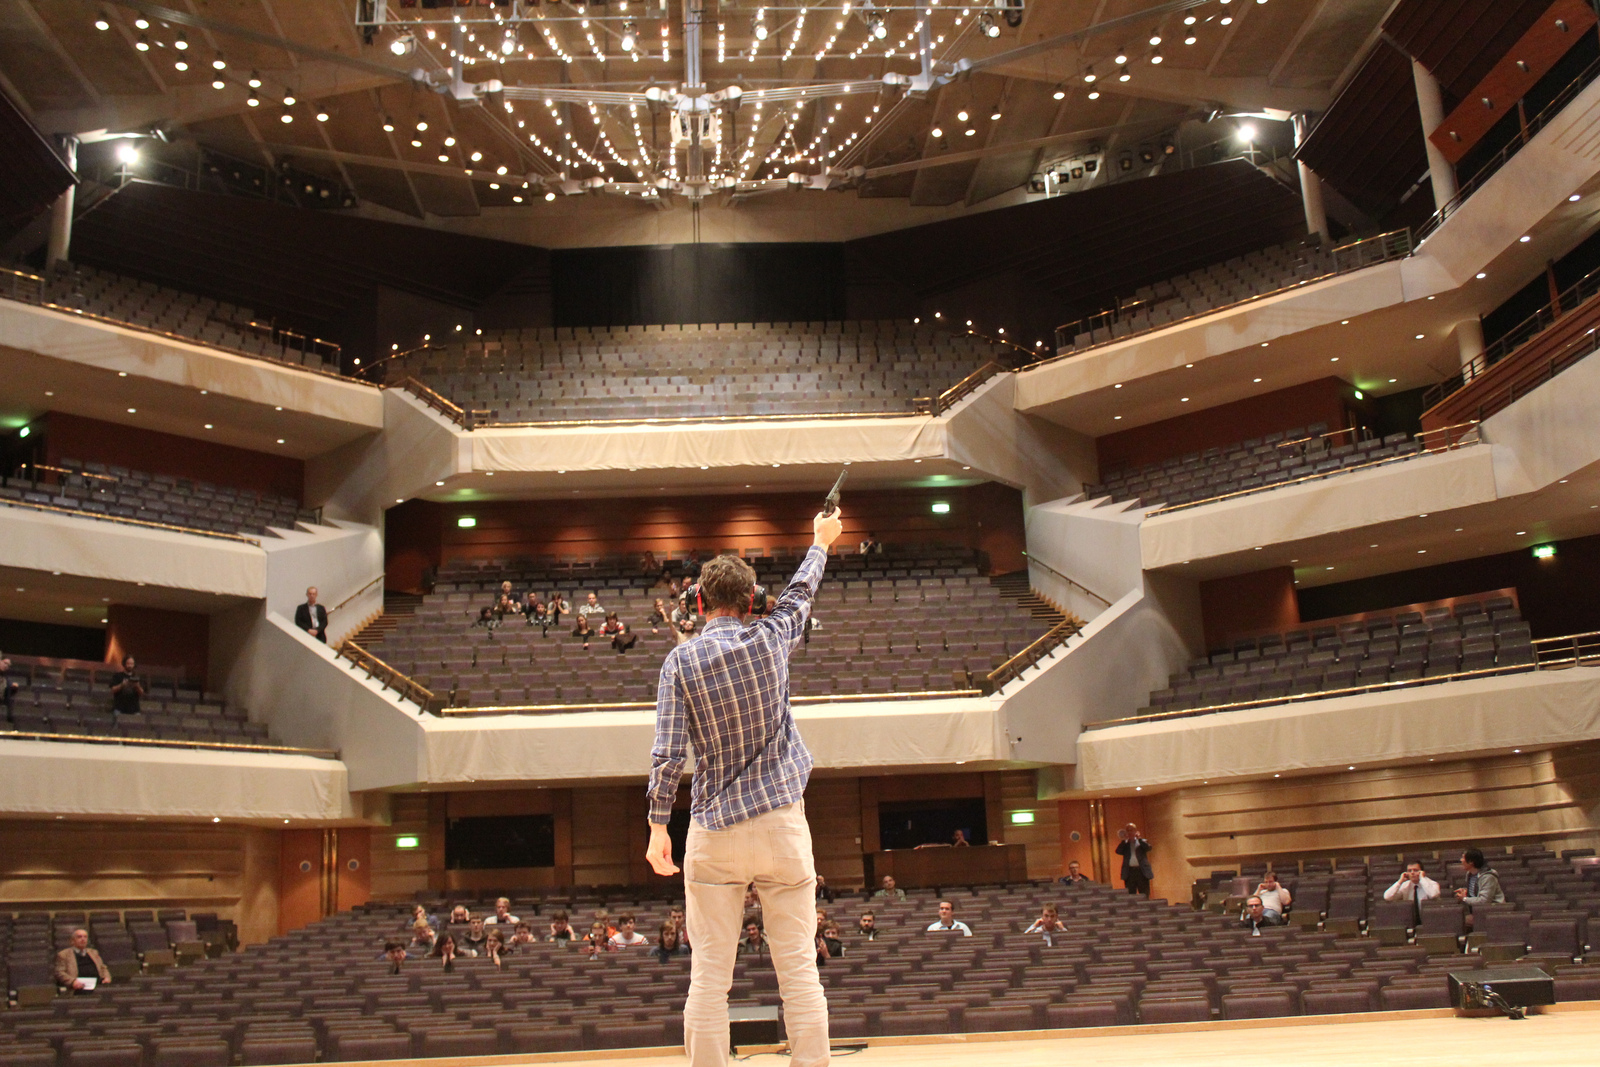
Choose an enclosure. This could be a stairwell, a basketball or requetball court, a classroom, a hallway, an auditorium, etc. Take a picture or pictures of the enclosure to include in your report.
Select a means for creating an impulsive signal. This could be a cap gun, blocks of wood, a balloon pop, hand clap, etc. Take a picture or pictures of your impulse generator to include in your report. (Wear ear protection as needed.)
Select and test a means for measuring an audio signal. Software such as Audacity may be useful for this. Microphones built into laptop computers can be used.
Choose a point within the enclosure for impulsive excitation and another point for impulse response measurement. For example, in a stairwell, you may want to impulse at the top and measure at the bottom. This would require two people working in coordination to perform the measurement.
Record the impulse response of the enclosure. Take a picture or pictures of your setup to include in your report.
Plot the impluse response and frequency response of the enclosure. For the impulse response plot, scale the
What is the approximate duration of the impulse response in seconds?
Save your impluse response in WAV format to include in your report.
Measure "dry" signals
Go into the anechoic chamber and record 15 seconds or more of speech.
Go into the anechoic chamber and record 15 seconds or more of a musical instrument.
Plot these signals with the
Make spectrogram plots of these signals to include in your report. Experiment with the FFT size, the window shape, and the overlap size until the time-frequency structure of the signals are visible.
Save your dry signals in WAV format to include in your report.
Note: The sample rate of these recordings should be the same as the sample rate used in the impulse response recording.
Synthesize "wet" signals
Using the Matlab programs from either CA1 or CA2, filter the dry signals through the measured impulse response. Listen to the filter output (wet signals) and comment on the filtering effect.
Save the filtered signals in WAV format to include in your report.
Write the report
Turn in a report describing the procedure used in this lab to measure the impulse response, to record dry signals, and to synthesize wet signals. Comment on what you learned.
What sample rate did you use? What effect does the sample rate have on the computational complexity of the filtering?
Include the plots of your measured impulse response and audio files described above.
Upload your report in PDF format to Canvas.